Comparing Web Performance Mechanics: Remix vs. Next.js on Waterfalls, Streaming, and Caching
Description provided by the user:
I need a slide for a technical presentation comparing the performance philosophies of two popular web frameworks, Remix and Next.js. The slide should visually contrast their approaches to data fetching, rendering, and caching. Please create a side-by-side comparison. For each framework, include a list of key performance-related features. More importantly, create a simplified waterfall chart to illustrate how they handle parallel vs. sequential data requests. Also, add a timeline visualization below each chart to show the typical 'Time to First Byte' (TTFB) and highlight how streaming helps deliver content faster. Use clear labels, a shared legend, and subtle animations to reveal the information step-by-step.
Open with the title and frame the slide: we are comparing how Remix and Next.js shape the waterfall and first byte timing.
Start on the left: Remix emphasizes parallel route loaders. Everything kicks off together, reducing classic waterfalls.
Highlight defer and Suspense: we can stream parts of the UI as data resolves, which moves the first meaningful bytes earlier.
Call out the browser HTTP cache: Remix leans on native caching, so repeat navigations or shared data show quick cache hits.
Move to the right: Next.js and React Server Components hoist fetches into the server graph. Many fetches resolve together and can be cached within that graph.
Note granular streaming: boundary-by-boundary streaming means multiple regions of the page can deliver bytes earlier.
Now point to the waterfalls: Remix shows parallel network lanes from time zero; Next shows server work overlapped with early streamed chunks and cache hits.
Draw attention to the timelines sliding in: the first byte appears earlier for the streamed paths in both, but typically earlier in the RSC graph for Next.js depending on cache hits and boundaries.
Close with the takeaway: both approaches pull first byte earlier by changing where work happens and what can stream. Choose the model that matches your team’s data boundaries and caching strategy.
Behind the Scenes
How AI generated this slide
The AI first deconstructs the request into core components: a side-by-side comparison of Remix and Next.js focusing on performance. Key concepts identified are waterfalls, streaming, caching, and Time to First Byte (TTFB).
A two-column layout is chosen for direct visual comparison. The AI designs a reusable 'ColumnBlock' React component to ensure consistency between the two sides, containing a title, bullet points, a waterfall chart section, and a timeline section.
To visualize the performance data, the AI creates a 'WaterfallRow' component. It then generates representative data for both frameworks: Remix data shows parallel network fetches starting from time zero, while Next.js data emphasizes server-side work and cache hits, reflecting the React Server Components (RSC) model.
The AI incorporates 'framer-motion' for animations to make the charts and text appear smoothly, enhancing engagement. It uses the '@slidebook/core/lib' 'Fragment' component to sequence these animations, allowing a presenter to reveal one point at a time.
A shared legend is created using a 'LegendItem' component and placed strategically for easy reference. The color scheme is chosen for clarity: blue for network, gray for server work, amber for streaming, and green for cache hits.
Finally, the AI generates comprehensive speaker notes. These notes provide a narrative flow, guiding the presenter on how to introduce the slide, explain the concepts for both Remix and Next.js, compare the visuals, and deliver a concluding takeaway.
Why this slide works
This slide excels because it translates complex software architecture concepts into a clear, digestible visual format. The side-by-side layout is a classic and effective method for comparison. Using simplified waterfall charts and timelines demystifies abstract ideas like request parallelization and streaming, making them accessible to a broader technical audience. The component-based React code is clean, modular, and easy to maintain. The inclusion of step-by-step animations via Fragments transforms a static slide into a dynamic storytelling tool, allowing the presenter to control the flow of information and maintain audience focus. This approach is highly effective for technical education and framework evaluation presentations.
Slide Code
You need to be logged in to view the slide code.
Frequently Asked Questions
What is a 'request waterfall' in web performance?
A request waterfall is a visualization that shows how a web browser downloads assets to render a page. Each asset (HTML, CSS, JavaScript, images, API data) is a bar on the chart, and its position and length show when the request started and how long it took. A 'waterfall' pattern emerges when one request must finish before the next one can begin, creating a cascading effect that can slow down page load times. Modern frameworks like Remix and Next.js use strategies like parallel data fetching and streaming to minimize these waterfalls.
How does Next.js with React Server Components (RSC) achieve an earlier 'first byte'?
Next.js with RSC can achieve an earlier Time to First Byte (TTFB) by doing more work on the server and streaming the result. Instead of waiting for all data to be fetched on the server before sending any HTML, RSC allows the server to send a static 'shell' of the page almost immediately. As data dependencies for different components are resolved on the server (often hitting a server-side cache), their resulting HTML is streamed to the browser. This means the browser receives and can start rendering content much sooner than in a traditional server-rendering model that waits for all data.
What is the main difference between Remix's `defer()` and Next.js's RSC streaming?
Both are streaming mechanisms, but they operate at different levels. In Remix, `defer()` is used within a route's `loader` function to send a primary response quickly while promising to stream the deferred, slower data later. This is often paired with React's `<Suspense>` on the client to show a fallback UI. Next.js's RSC streaming is more granular and integrated into the rendering model. The entire component tree can be streamed from the server as it's rendered. This means multiple, independent parts of the page can be streamed as their data becomes available on the server, without the developer explicitly managing deferred promises for each slow piece of data.
Why does the Remix waterfall in the slide show parallel network requests?
The Remix waterfall shows parallel network requests because of its architectural design. Remix's routing system is designed to run all the `loader` functions for the matching nested routes on a page in parallel. This means that if a page has a root layout, a sidebar, and a main content area, the data fetches for all three can be initiated simultaneously. This avoids the common waterfall problem where the child component's data fetch can only start after the parent component's data has been fetched and rendered.
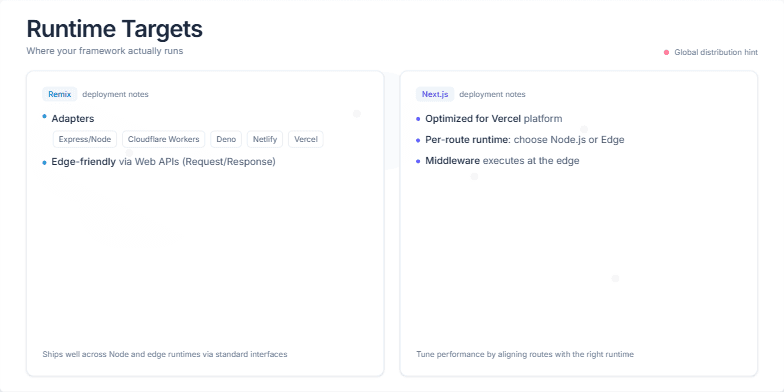
I need a presentation slide that compares the runtime target strategies of two popular web frameworks, Remix and Next.js. The slide should visually explain where the code for each framework runs. For Remix, highlight its adapter-based model that allows it to run on various platforms like Node.js, Cloudflare Workers, and Deno. For Next.js, focus on its optimization for Vercel, its ability to choose runtimes (Node.js or Edge) on a per-route basis, and how its middleware runs at the edge. The overall theme should be global distribution and performance, so please incorporate a subtle world map and some visual indicators to represent a global network.
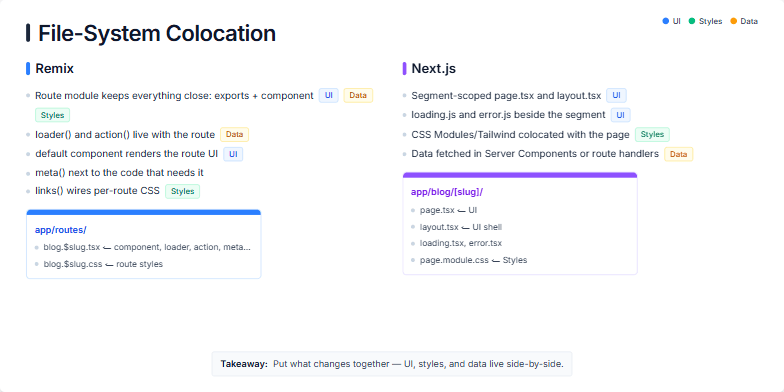
The user requested a slide that visually compares the file-system colocation principles of two popular web development frameworks: Remix and Next.js. The goal is to illustrate how each framework encourages developers to organize and group related code for UI, styling, and data fetching. The slide should use a clear, side-by-side layout, incorporate visual aids like folder structure diagrams, and use a color-coded legend to differentiate between UI, styles, and data logic. The presentation should conclude with a strong, memorable takeaway message summarizing the benefits of this architectural approach.
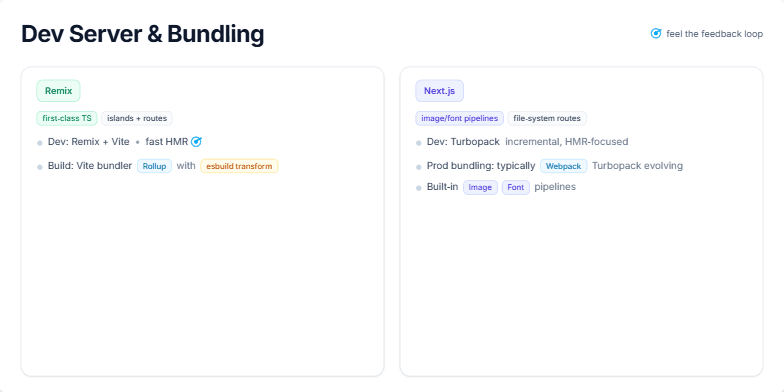
This slide was generated to provide a clear, side-by-side comparison of the development server and production bundling toolchains for two leading React frameworks: Remix and Next.js. The goal is to highlight the key technologies each framework employs, such as Vite and Turbopack for development, and Rollup and Webpack for production builds. The user wanted to understand the trade-offs and core philosophies behind each stack, focusing on developer experience aspects like Hot Module Replacement (HMR) speed and unique features like Next.js's integrated image and font pipelines. The visual design should be clean, using cards to separate the information for each framework and pills to emphasize specific tools.
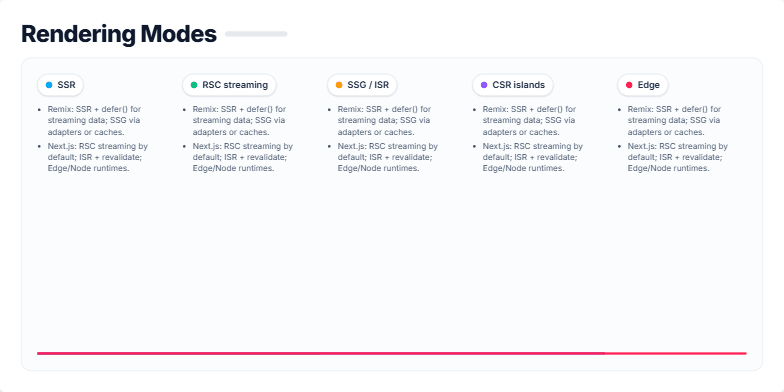
This slide provides a comparative analysis of the primary rendering strategies in modern web development, specifically focusing on their implementation within the Next.js and Remix frameworks. It visually breaks down Server-Side Rendering (SSR), React Server Components (RSC) streaming, Static Site Generation (SSG) / Incremental Static Regeneration (ISR), Client-Side Rendering (CSR) islands, and Edge computing. The goal is to clarify the trade-offs and use cases for each mode, helping developers choose the most appropriate architecture for performance, SEO, and user experience.
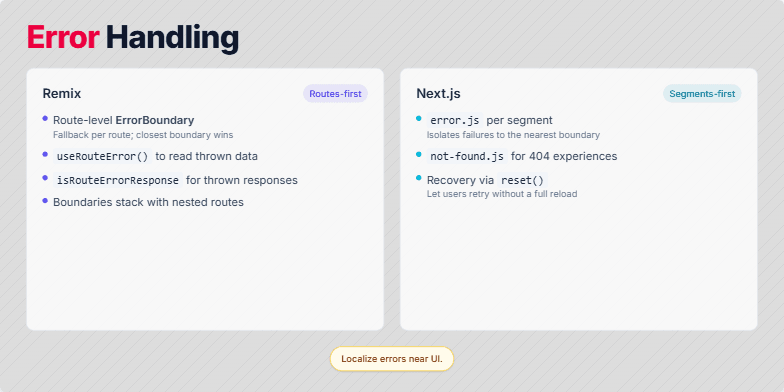
The user wants a slide that compares and contrasts the error handling mechanisms in two popular React frameworks: Remix and Next.js. The slide should be visually structured to highlight the key differences and similarities. It needs to explain Remix's route-based `ErrorBoundary` system and Next.js's segment-based `error.js` file convention. Key concepts to include are `useRouteError` for Remix, and `not-found.js` and the `reset()` function for Next.js. The overall message should emphasize the modern web development practice of localizing error boundaries close to the UI components to improve application resilience and user experience.
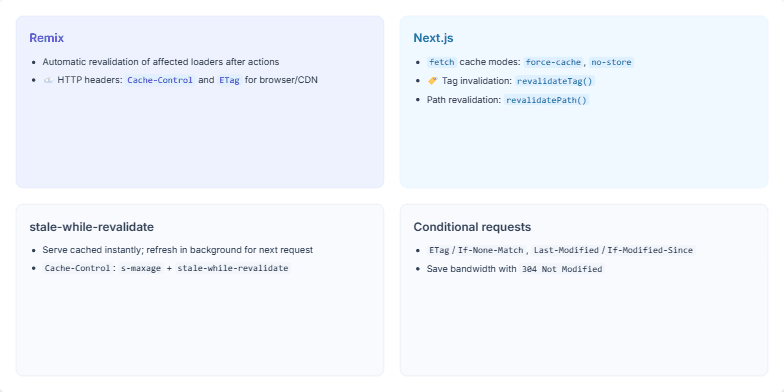
I need a slide for a tech talk aimed at mid-level web developers. The goal is to compare and contrast data revalidation and caching strategies in modern web frameworks. Please create a 2x2 grid layout. The top two panels should compare Remix and Next.js. For Remix, focus on automatic revalidation and HTTP caching headers. For Next.js, highlight its fetch cache modes and tag/path-based revalidation. The bottom two panels should cover fundamental web standards: one for the 'stale-while-revalidate' pattern and another for conditional requests using ETags and Last-Modified headers. Keep the design clean and use color coding to differentiate the panels.
Want to generate your own slides with AI?
Start creating high-tech, AI-powered presentations with Slidebook.