This slide uses a vibrant color palette of greens and oranges, reminiscent of fresh ingredients and warm restaurant lighting. A playful animation shows coins flying from a wallet into a steaming pot versus a restaurant bill, highlighting the cost difference. Clean, sans-serif fonts and crisp icons create a modern and easily digestible design. The overall mood is lighthearted and engaging, encouraging the audience to consider their spending habits.
Categories
Generated Notes
Open by framing the question: Cook at home or eat out? The palette sets a friendly, food-themed mood.
Reveal the home side. Point to the green pot and the coins flying into it. Emphasize the average $4–$7 per meal and why: bulk buying, leftovers, and control over portions.
Reveal the eat-out side. Show the receipt, highlight the higher bar and the coins flying into the bill. Explain the $15–$25 range due to service, ambiance, and convenience costs.
Reveal the verdict badge. Summarize: cooking often saves about three times per meal. Invite the audience to consider shifting a few meals per week to home cooking for noticeable savings.
Behind the Scenes
How AI generated this slide
Analyze the topic and context to understand the core message: cost comparison of home cooking vs. eating out.
Select a vibrant color palette (greens and oranges) aligning with fresh ingredients and restaurant ambiance, enhancing visual appeal.
Choose clean sans-serif fonts and crisp icons for a modern, easily digestible design, improving readability.
Design a playful animation of coins moving from a wallet to a pot/bill, visualizing the cost difference and adding engagement.
Structure the layout with clear sections for home cooking and eating out, ensuring information clarity.
Incorporate data visualization elements (bar graphs, average cost figures) to present cost data effectively.
Craft concise and impactful text content, highlighting key takeaways and encouraging audience reflection on spending habits.
Why this slide works
This slide effectively communicates the cost-saving benefits of cooking at home versus eating out. The vibrant color palette and playful animation create an engaging visual experience, while the clean fonts and icons ensure readability. The use of data visualization through bar graphs and cost figures clearly illustrates the financial difference, making the information easily digestible. The concise text content reinforces the key message and encourages the audience to consider their spending habits. The animation provides a dynamic element that further captures attention and reinforces the core message. The overall design is modern, professional, and persuasive, making it a valuable tool for presentations on personal finance, food and lifestyle, or budgeting.
Slide Code
You need to be logged in to view the slide code.
Frequently Asked Questions
How does this slide help with budgeting?
This slide visually demonstrates the significant cost difference between cooking at home and eating out, empowering viewers to make informed decisions about their food spending and incorporate home cooking into their budget for potential savings. By visualizing the average cost per meal, it highlights the financial advantages of preparing meals at home, encouraging budget-conscious choices.
What design elements enhance the slide's effectiveness?
The slide leverages a vibrant color scheme of greens and oranges, evoking fresh ingredients and warm restaurant lighting, creating an appealing visual contrast. Playful animations of coins flying into a pot or a restaurant bill dynamically illustrate the cost flow, enhancing engagement. Clean sans-serif fonts and crisp icons contribute to a modern and easily digestible design, promoting readability and a professional look.
How can this slide be used in different presentations?
This slide is versatile and can be incorporated into presentations on various topics, including personal finance, budgeting, healthy eating, food and lifestyle, or even entrepreneurship (for example, meal prepping businesses). It serves as a compelling visual aid to illustrate the economic benefits of home cooking and encourage mindful spending habits.
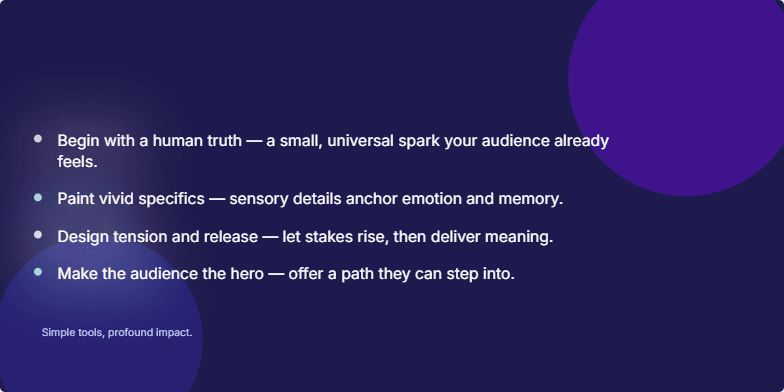
Deep indigo background evokes a sense of mystery and creativity. Title appears in elegant, handwritten script, fading in gently. Each key point of the presentation is introduced with a delicate watercolor animation, like ink blooming in water. Soft, ambient music underscores the quiet power of storytelling. Minimalist design with ample whitespace emphasizes the beauty and clarity of each message. Close-ups on evocative photographs further enhance the emotional impact.
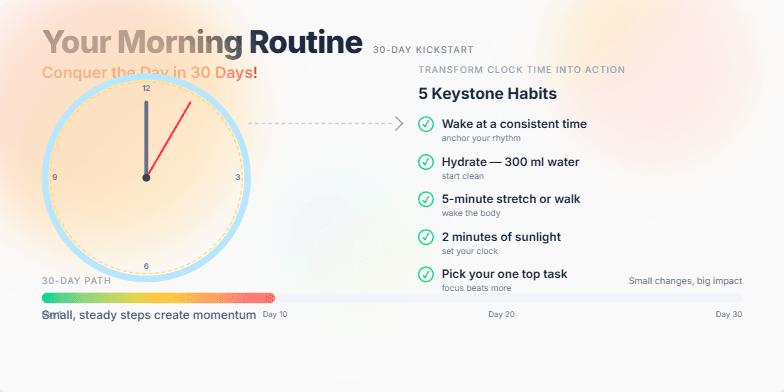
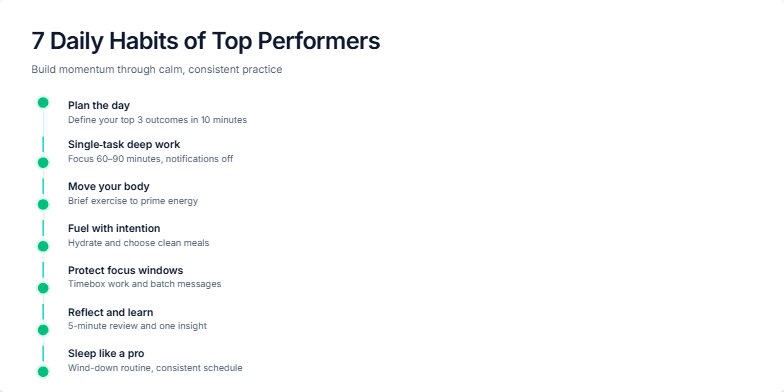
Imagine waking up to a slide bathed in the warm glow of sunrise hues. A stylized clock face animates, ticking off the seconds, transforming into a vibrant checklist. Crisp, clean typography highlights key habits, while subtle watercolor splashes represent the fluidity of a personalized routine. This visually calming yet energizing design inspires you to embrace the power of small changes for a big impact.
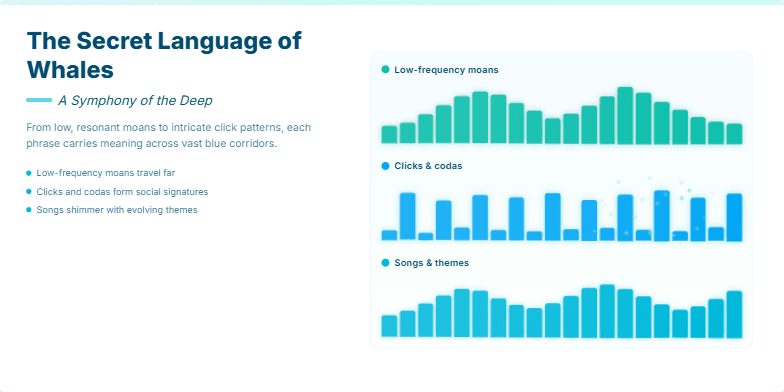
Dive into an ocean of calming blues and deep teals as we explore the mesmerizing vocalizations of whales. Ethereal underwater imagery blends seamlessly with stylized waveform visualizations that pulse and shimmer with each whale song. Experience the magic of bioluminescence with subtle glowing particle effects that dance across the screen, adding a touch of wonder to this immersive auditory and visual journey.
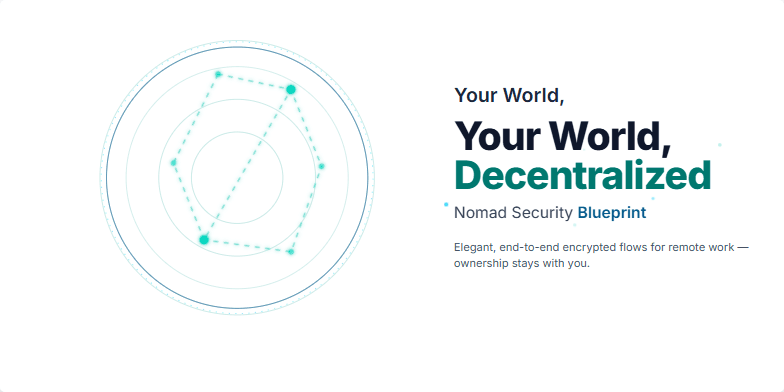
This slide opens with a stylized, low-poly wireframe globe slowly rotating, pulsing with interconnected nodes of light representing secure data streams. A cool, calming color palette of deep blues and teals evokes a sense of trust and technological sophistication. As the title appears, subtle particle effects shimmer around the words 'Decentralized' and 'Blueprint.' The overall aesthetic is sleek and minimalist, emphasizing the elegance of secure, remote work solutions for the digital nomad.
Clean, minimalist design with a soothing palette of blues and greens. Each habit is revealed through a subtle animation, like a growing plant or a rising sun, symbolizing growth and progress. Soft background music enhances the serene and inspirational mood. Short, impactful descriptions accompany each habit, presented in a clear, modern sans-serif font.
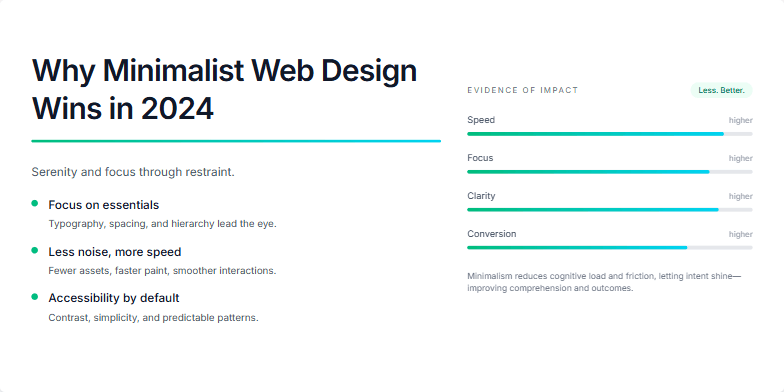
This slide showcases the power of minimalism through sleek, elegant typography, a calming grayscale palette punctuated by vibrant accent colors, and smooth, subtle animation of design elements appearing as if drawn on a canvas. Experience the serenity and focus minimalist design brings to the forefront.
Want to generate your own slides with AI?
Start creating high-tech, AI-powered presentations with Slidebook.