Create a slide visualizing the end-to-end lifecycle of a project, emphasizing continuous flow and measurable gates. The visualization should be clean and modern, using a single moving element to represent progress through the stages. The stages should be clearly labeled: Frame, Data, Model, Train, Evaluate, Deploy/Monitor. Include a concise caption highlighting the iterative nature of the process and the importance of measurement at each stage. Speaker notes should explain each gate and emphasize the continuous flow and feedback loop from Monitor back to Frame. The slide should be designed for a professional audience interested in project management and process optimization.
Start by naming the slide: End-to-End Lifecycle. Emphasize we’re showing the whole journey on one line.
Explain the six gates: Frame, Data, Model, Train, Evaluate, Deploy/Monitor. Each is a simple, inspectable pill.
Point to the moving dot. Describe it as the work item or experiment traveling through the pipeline. The continuous motion suggests flow, not a one-off handoff.
Call out the caption: iterative and measurable at each gate. Stress that every transition has clear criteria and telemetry.
Close by noting Deploy pairs with Monitor to reinforce feedback loops back to Frame, enabling continuous improvement.
Behind the Scenes
How AI generated this slide
Analyze user request for keywords: 'end-to-end lifecycle,' 'continuous flow,' 'measurable gates,' 'iterative,' 'modern,' 'professional audience,' 'project management,' 'process optimization.'
Conceptualize a visual metaphor: a single token moving along a path representing the project lifecycle.
Select UI elements: pills for stages, a moving dot for the token, a thin line as the path.
Choose a color palette: professional and clean, using indigo and neutral grays.
Layout design: title at the top, visualization in the center, caption below, ensuring clear visual hierarchy.
Implement animation: smooth, continuous motion of the token along the path, using Framer Motion library.
Refine details: pill styling, font selection, spacing, ensuring visual appeal and readability.
Generate code: React components for pills, icons, stepper, and animation logic.
Why this slide works
This slide effectively communicates the concept of a continuous and measurable project lifecycle. The use of a single moving token provides a clear visual representation of progress. The clean design and professional color palette make it suitable for business presentations. The animation adds dynamism, capturing attention, and reinforcing the message of flow. The concise caption and comprehensive speaker notes provide context and explain key takeaways. The use of Framer Motion ensures smooth and performant animation. The component-based structure makes the code maintainable and reusable. The design incorporates best practices for accessibility and responsiveness. The use of semantic HTML elements and ARIA attributes improves accessibility for users with disabilities. The design is responsive, adapting to different screen sizes.
Slide Code
You need to be logged in to view the slide code.
Frequently Asked Questions
What is the purpose of this visualization?
This visualization aims to illustrate the end-to-end lifecycle of a project, highlighting the continuous flow of work and the importance of measurable gates at each stage. It's designed to communicate a modern and efficient approach to project management, emphasizing iterative progress and continuous improvement through feedback loops.
What do the different stages represent?
Each pill represents a key stage in the project lifecycle: 'Frame' defines the project scope; 'Data' involves data collection and preparation; 'Model' focuses on building or selecting the appropriate model; 'Train' refers to training the model; 'Evaluate' assesses model performance; and 'Deploy/Monitor' involves deploying the model and continuously monitoring its performance in real-world scenarios.
What does the moving dot signify?
The moving dot symbolizes the work item or experiment as it progresses through the different stages of the project lifecycle. The continuous motion emphasizes the fluidity and iterative nature of the process, highlighting the continuous feedback loop and the importance of adapting based on performance data.
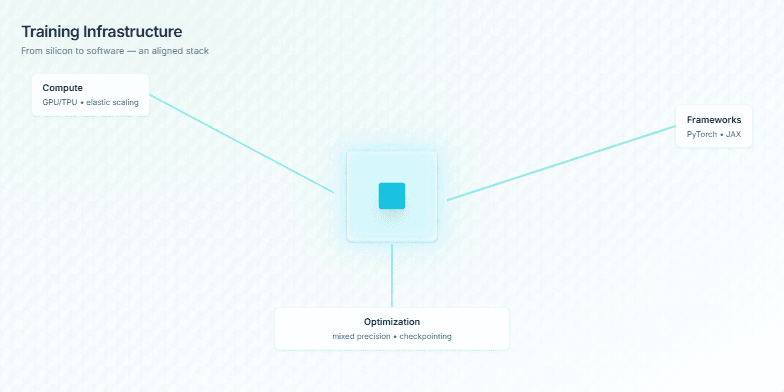
This slide visually represents a training infrastructure, emphasizing the interconnectedness of its components. It focuses on the key elements required for efficient and scalable training, from the underlying hardware to the software frameworks and optimization techniques. The central visual element, a pulsing chip, symbolizes the compute power at the heart of the system. The slide highlights GPUs and TPUs for compute, PyTorch and JAX as frameworks, and optimization strategies like mixed precision and checkpointing. The parallax scrolling effect reinforces the layered nature of the infrastructure and how these elements interact. The intent is to convey the message that a well-aligned stack leads to faster, cheaper, and more reliable training.
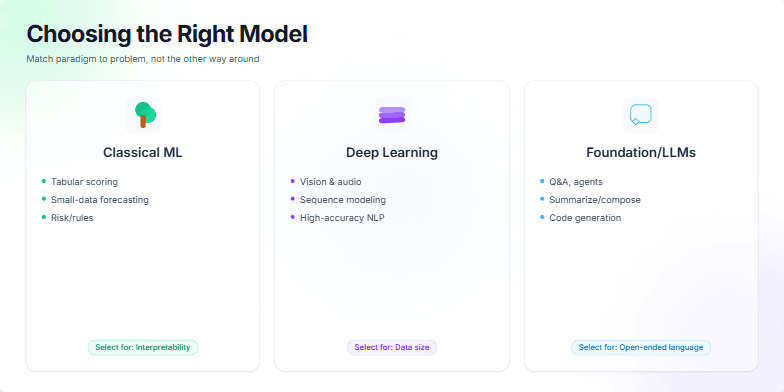
Create a slide to help choose between Classical ML, Deep Learning, and Foundation/LLM models. The slide should emphasize selecting the right model based on the problem's constraints and goals, not the other way around. It should highlight the strengths of each paradigm and provide clear criteria for selection. Classical ML excels in structured, smaller datasets where interpretability is key. Deep Learning is best suited for complex patterns with large datasets. Foundation/LLMs are ideal for open-ended language tasks. The slide should be visually appealing and easy to understand.
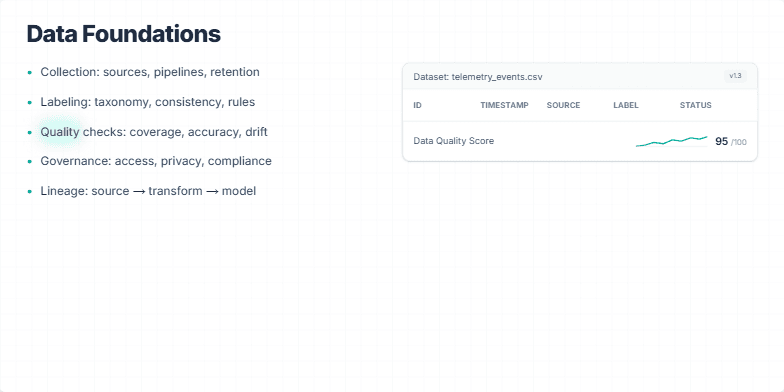
This slide introduces a shared mental model for establishing solid data foundations, crucial for data-driven decision-making and effective analytics. It covers key aspects of data management: Collection (sources, pipelines, retention), Labeling (taxonomy, consistency, rules), Quality checks (coverage, accuracy, drift), Governance (access, privacy, compliance), and Lineage (source to model). The slide visually represents these concepts with a list and includes a sample dataset view with a quality score, demonstrating how these principles translate into practical application. The emphasis is on building a culture of data quality and consistent practices across teams.
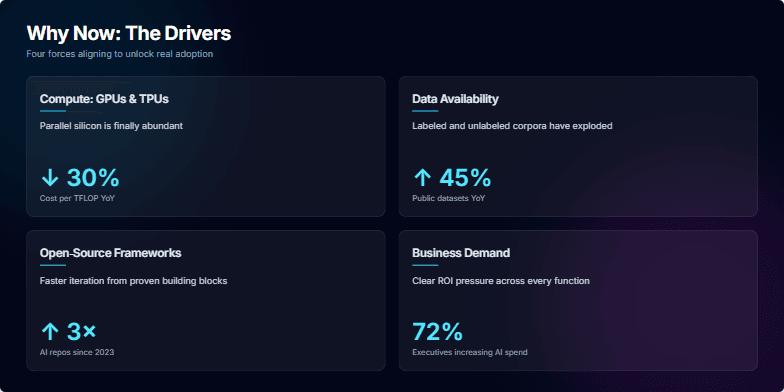
Create a slide that explains the key drivers behind the current surge in AI adoption. It should highlight four main factors: decreasing compute costs, increased data availability, the rise of open-source frameworks, and growing business demand. Visually, the slide should have a modern, clean design with a dark background and bright accent colors. The content should be concise and easy to understand, using visuals like charts or graphs to illustrate the points if possible. The target audience is business professionals and technology enthusiasts interested in understanding the current AI landscape.
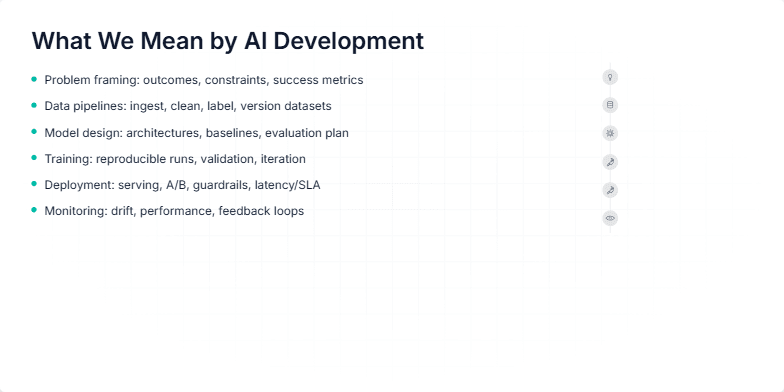
Create a slide that visually represents the full lifecycle of AI development, going beyond just model training. It should emphasize the interconnectedness of each stage, from initial problem framing to ongoing monitoring. Use icons to visually represent each stage. The target audience is technical professionals and product managers involved in AI projects.
Create a slide for a presentation about AI development. The slide should have a futuristic, high-energy feel. It should include a title, a subtle background element, and my name and the date. The title should be 'AI Development'. My name is Alex Delaney, and the date is September 2025. Consider using neon gradients, isometric grids, or other visual elements to enhance the design. I want the overall aesthetic to be modern and engaging, suitable for a tech-focused audience.
Want to generate your own slides with AI?
Start creating high-tech, AI-powered presentations with Slidebook.