Cost & Performance Tuning for Optimal Business Outcomes
Description provided by the user:
Create a slide about cost and performance tuning, emphasizing the importance of finding a balance between the two for optimal business outcomes, not just raw speed. The content should cover strategies for achieving this balance, including profiling, batching, quantization, distillation, caching, autoscaling, and spot instances. It should also visually represent the relationship between cost and latency, highlighting the 'sweet spot' where optimal balance is achieved. Include specific examples like using KV cache or mixed precision to operate near this sweet spot. Finally, emphasize the iterative nature of this process and the need for continuous monitoring and adjustment.
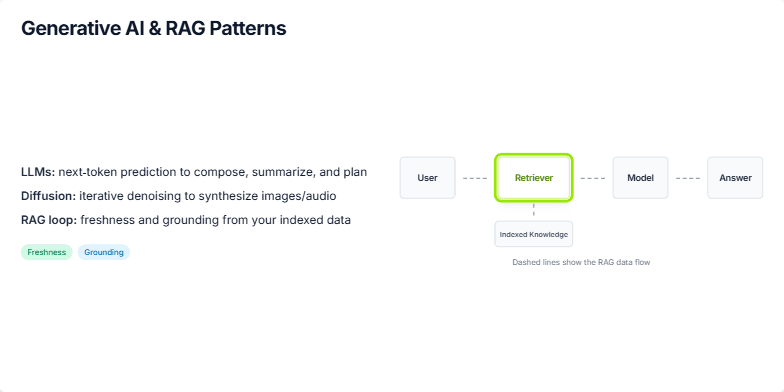
Title first: we’re balancing cost against latency. We want the best business outcome, not just raw speed.
Left column: start with profiling hotspots—measure before you move. Then batching to increase throughput without hurting perceived latency.
Continue with quantization/int8 and distillation—model-level optimizations that shrink compute and memory while keeping quality within target.
Then caching—both response and KV cache to avoid redoing work. Autoscaling ensures we match load patterns. Finally, spot instances to reduce infra spend when appropriate.
Right chart: as latency drops too far, cost climbs; as we relax latency, cost falls, but gains flatten. The sweet spot marks the knee of the curve—great latency for materially lower cost.
Callouts: KV cache helps push left on latency without big cost increases; mixed precision cuts cost while holding latency. Use these to operate near the sweet spot.
Close: iterate—profile, apply one tactic, re-measure, and keep the system at the sweet spot as traffic and models evolve.
Behind the Scenes
How AI generated this slide
Analyze user request for keywords: cost, performance, tuning, latency, business outcomes, optimization strategies, sweet spot, iterative process.
Conceptualize slide layout: title, two-column structure (bullet points for strategies, chart for visual representation).
Create chart visualizing the relationship between latency and cost, marking the 'sweet spot' and adding annotations for specific strategies (KV cache, mixed precision).
Design visual elements: color scheme, font styles, animations for emphasis (pulsating sweet spot).
Generate speaker notes elaborating on each strategy and emphasizing the iterative nature of cost and performance tuning.
Why this slide works
This slide effectively communicates the importance of balancing cost and performance. The two-column layout provides a clear structure, presenting optimization strategies alongside a visual representation of their impact. The chart clearly illustrates the concept of the 'sweet spot,' making the core message easily digestible. The use of animations draws attention to key elements, and the detailed speaker notes provide valuable context and actionable insights for achieving optimal business outcomes. Relevant keywords like cost optimization, performance tuning, latency reduction, and business strategy are integrated throughout the slide and notes, enhancing its SEO value.
Slide Code
You need to be logged in to view the slide code.
Frequently Asked Questions
What is the 'sweet spot' in cost and performance tuning?
The 'sweet spot' represents the optimal balance between cost and performance, where you achieve acceptable latency for a significantly lower cost. It's the point on the cost-latency curve where further latency reductions yield diminishing cost benefits. Finding this point is crucial for maximizing business outcomes, as it avoids overspending on performance gains that offer minimal practical value.
How can I find the 'sweet spot' for my application?
Finding the sweet spot involves an iterative process of profiling, implementing optimization strategies, and measuring their impact. Start by identifying performance bottlenecks through profiling tools. Then, apply optimization techniques like batching, quantization, caching, or autoscaling. Continuously monitor the impact on both cost and latency to determine the point where further optimizations become less cost-effective. This requires careful consideration of your application's specific requirements and performance goals.
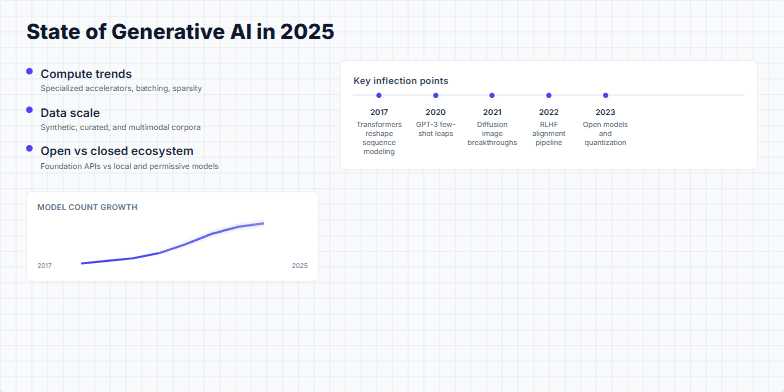
Create a presentation slide that provides a comprehensive overview of the state of Generative AI in 2025. The slide should be structured to first introduce key driving trends like compute, data scale, and the open vs. closed ecosystem. It should then present a historical timeline of major AI milestones from 2017 to 2025, highlighting key inflection points such as Transformers, GPT-3, and RLHF. Conclude with a summary of recent shifts and future-looking priorities like agentic AI and on-device efficiency. The design should be modern, clean, and use data visualization elements like a sparkline chart to illustrate growth.
I need a professional and modern title slide for a tech conference presentation. The topic is 'Generative AI', with the subtitle 'Systems, Scaling, and Safety'. The speaker is Maya Chen, Principal Research Engineer at Vector Labs. The event is the AI Systems Summit 2025 in San Francisco on Oct 8. The design should be dark, sophisticated, and minimalist, using subtle animations to reveal the text elements sequentially. It should have a clean, technical feel. Please also generate detailed speaker notes for a calm, authoritative opening that introduces the topic and sets the agenda for the talk.
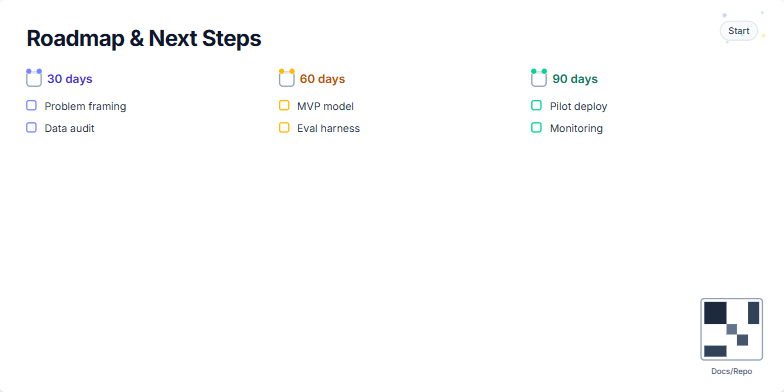
Create a slide visualizing a 30/60/90 day roadmap for a project. The roadmap should include key milestones for each phase, such as problem framing and data audit (30 days), MVP model and evaluation harness (60 days), and pilot deployment and monitoring (90 days). The slide should have a clean and modern design, incorporating a progress indicator or timeline element. Include a 'Start' badge to signify the beginning of the roadmap. The slide should also include a subtle visual element to draw attention to the start of the roadmap. A small, unobtrusive QR code linking to relevant documentation or repository should be placed on the slide. The overall tone should be professional and project-oriented, emphasizing clear goals and progress tracking.
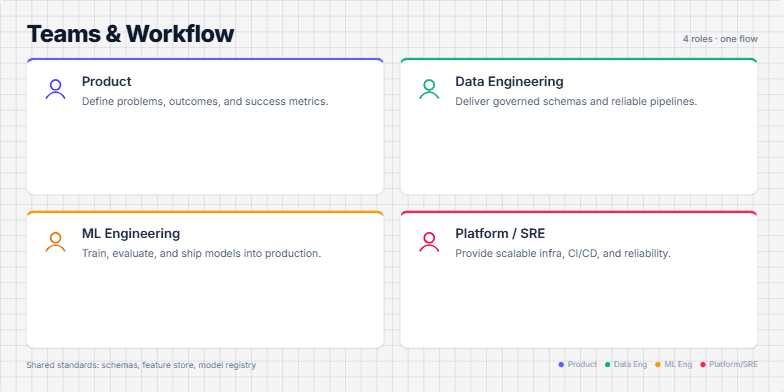
This slide visually represents the workflow and collaboration between different teams (Product, Data Engineering, ML Engineering, and Platform/SRE) involved in a product's lifecycle, from ideation to production. It emphasizes the roles and responsibilities of each team and highlights the importance of shared standards (schemas, feature store, model registry) for a streamlined and efficient process. The slide uses distinct colors and icons for each team, facilitating quick comprehension of their respective contributions. The animation further enhances engagement by sequentially introducing each team's role.
Explain the concept of Retrieval Augmented Generation (RAG) in the context of Generative AI. The slide should focus on how RAG addresses the limitations of Large Language Models (LLMs) by incorporating external knowledge sources. Explain how the RAG loop works, emphasizing the role of the retriever and its connection to indexed knowledge. Highlight the benefits of freshness and grounding that RAG brings. Visually represent the flow of information in a RAG system, including the user, retriever, model, and the final answer.
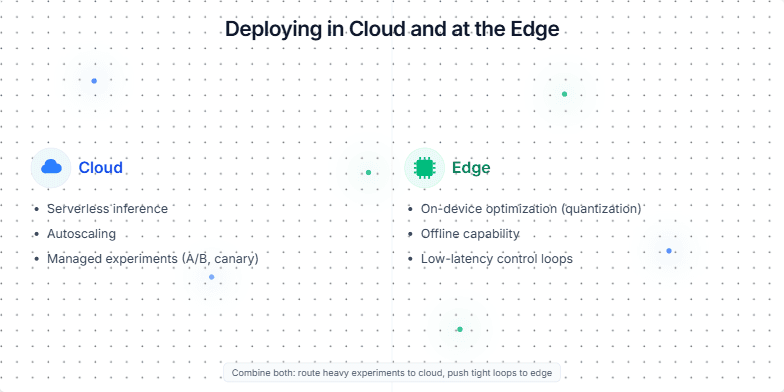
Create a slide that compares and contrasts deploying machine learning models in the cloud versus at the edge. Highlight the advantages and disadvantages of each approach, and suggest scenarios where one might be preferred over the other. The slide should be visually appealing and easy to understand, using clear language and concise bullet points. Consider using icons or visuals to represent cloud and edge deployments. The target audience is technical professionals and business stakeholders who are involved in making decisions about ML model deployment.
Want to generate your own slides with AI?
Start creating high-tech, AI-powered presentations with Slidebook.