Outcomes, Impact Goals & Next Steps for Enhanced User Experience
Description provided by the user:
This slide is for a presentation concluding a discussion about improving a product, likely a software application. It aims to summarize the desired outcomes, quantify the impact goals with specific targets, and outline the next steps for achieving these goals. The presenter wants to emphasize a target-oriented mindset and invite the audience to engage with a prototype for validation. The slide needs to visually represent key metrics like completion rate, time to first export, and support tickets, along with a list of actionable next steps. Animations should be used to introduce elements sequentially, guiding the audience's attention and enhancing engagement. The overall tone should be positive and forward-looking, encouraging collaboration and feedback on the proposed plan.
Title: I’ll wrap by aligning on our intended outcomes, the impact we’re targeting, and what we’ll do next.
First stat card: Completion rate — we’re aiming for a 15% lift; the number ticks up to reinforce the target mindset.
Second stat card: Time to first export — our goal is under five minutes to value; speed matters in first-run success.
Third stat card: Support tickets — goal is a 25% reduction by closing gaps in clarity and flow.
Next steps list: Expand the template library, add localized content, instrument analytics on section usage, and introduce guided onboarding.
CTA: Invite the audience to view the prototype so we can validate these targets quickly.
Close by reinforcing that these are targets, not claims, and that we’ll measure and iterate.
Behind the Scenes
How AI generated this slide
Establish the slide title: 'Outcomes, Impact Goals & Next Steps' to clearly communicate the slide's purpose.
Design three stat cards to visually represent key performance indicators (KPIs) with icons, labels, target values, and animated count-up effects for engagement.
Create a section for 'Next Steps' with a list of actionable items, each highlighted with a bullet point and subtle animations for visual appeal.
Incorporate a call to action button labeled 'View Prototype' to encourage audience participation and feedback.
Implement smooth transitions and animations using Framer Motion to create a polished and professional presentation experience.
Why this slide works
This slide effectively combines data visualization with actionable next steps, creating a compelling narrative for product improvement. The use of animations enhances engagement and guides the audience's focus. Clear metrics and targets demonstrate a data-driven approach, while the call to action promotes collaboration and feedback. The clean design and layout contribute to a professional and persuasive presentation.
Slide Code
You need to be logged in to view the slide code.
Frequently Asked Questions
What is the purpose of the 'CountUp' component?
The 'CountUp' component is used to animate the numerical values within the stat cards, creating a dynamic visual effect that draws attention to the key performance indicators and their target values. This animation enhances audience engagement and adds a touch of visual polish to the presentation.
How does Framer Motion enhance the slide's presentation?
Framer Motion is a library that powers the smooth animations and transitions throughout the slide. It allows for sophisticated choreography of elements, creating a visually appealing and engaging presentation experience. For example, the stat cards and list items fade in and slide up smoothly, guiding the audience's attention through the content in a structured manner.
What is the significance of the 'View Prototype' button?
The 'View Prototype' button serves as a call to action, encouraging the audience to interact with a tangible representation of the proposed improvements. This interactive element fosters collaboration and allows for early feedback, which can be invaluable in the product development process.
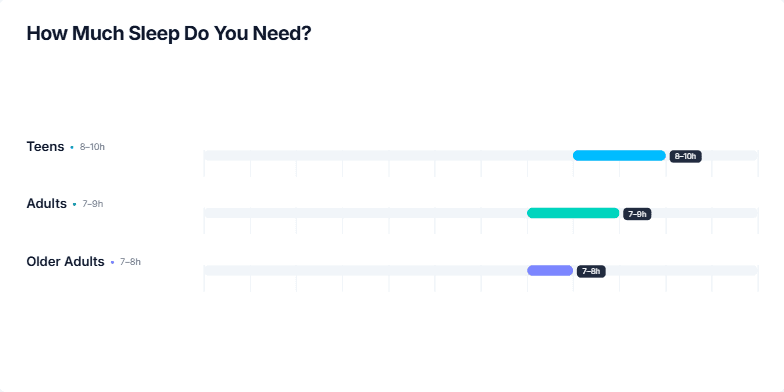
Create a slide about the negative health consequences of sleep deprivation. It should emphasize the increased risks of various health problems due to lack of sleep. The slide should be visually appealing and easy to understand, using clear language and concise explanations. It should cover the connection between sleep debt and cardiovascular issues, type 2 diabetes, weight gain, and mental health problems like depression and anxiety. Include specific statistics or facts to support these claims. The design should be professional and suitable for a presentation to a general audience.
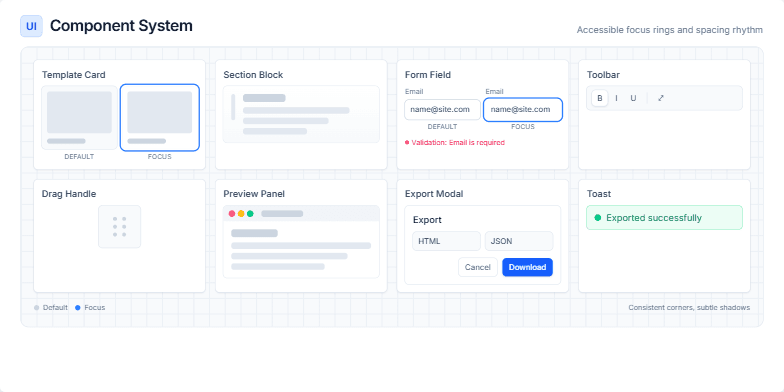
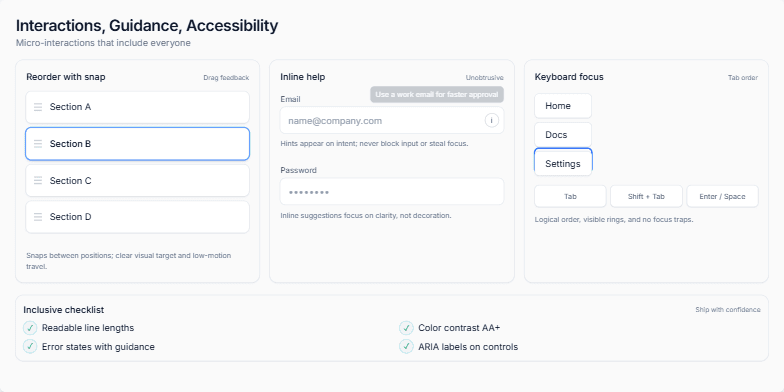
This slide showcases a modular component system for building user interfaces, emphasizing consistency and accessibility. It demonstrates various UI elements like template cards, section blocks, form fields, toolbars, drag handles, preview panels, export modals, and toasts. Each component is presented in its default, hover, and focus states, highlighting the consistent use of corners, shadows, and spacing rhythm. The slide also emphasizes accessibility features such as strong focus rings and validation messages. The design includes subtle gridlines and a soft backdrop for an organized canvas. The speaker notes provide a detailed walkthrough of each component and its features, including interaction previews and accessibility considerations.
Create a slide about designing a sleep environment for better sleep. It should cover the key elements of a good sleep environment, such as temperature, light, noise, and consistency. The slide should have a checklist format, and visually dim a bedroom image as each checklist item is completed. Include speaker notes that elaborate on each checklist item and offer specific recommendations. Add a sound effect when a checklist item is completed, with a toggle to turn the sound on or off.
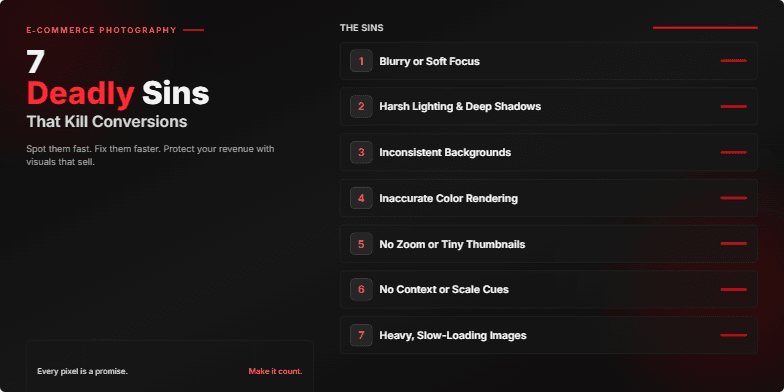
Dark, moody visuals with crimson highlights emphasize the 'deadly' theme. Bold typography and dramatic, fast-paced transitions between slides create a sense of urgency and highlight the costly mistakes. Each 'sin' is revealed with a stylized 'shattering glass' animation, adding a touch of visual flair.
This slide visually compares early low-fidelity wireframes with refined mid-fidelity designs, highlighting key structural changes and improvements in clarity and flow. It showcases two versions of an interface side-by-side, allowing for direct comparison and demonstration of the iterative design process. The left side presents the initial wireframe (v0.2), while the right side displays the improved mid-fidelity version (v0.5). The slide utilizes callouts to explain specific changes made between iterations, focusing on improvements in control consolidation, live preview integration, and progress visibility. A hover effect on the mid-fidelity wireframe triggers a cross-dissolve animation, revealing the underlying low-fidelity version for a quick visual overview of the evolution. The slide aims to communicate the design decisions and rationale behind the improvements, emphasizing the value of iteration in user interface design.
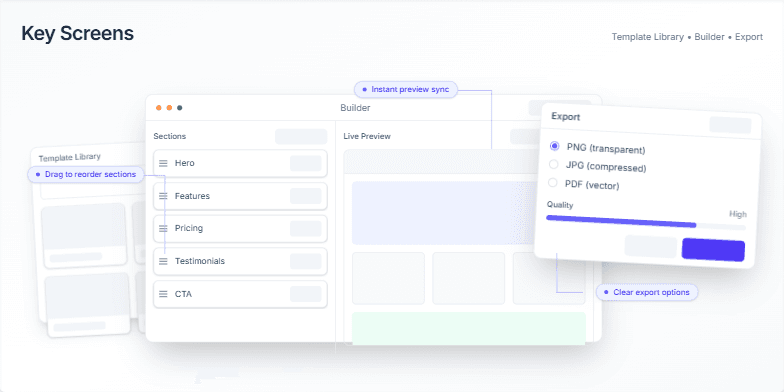
This slide showcases the three core user interfaces of our design tool: the Template Library, the Builder, and the Export Modal. The goal is to emphasize the seamless workflow and intuitive design that allows users to quickly create and export high-quality visuals. The Template Library offers pre-designed templates with clear filtering and preview options. The Builder features a split-screen view with a live preview that updates instantly as edits are made. The Export Modal allows users to select their desired format and quality level with ease. The overall design aims for polish, speed, and efficiency.
Want to generate your own slides with AI?
Start creating high-tech, AI-powered presentations with Slidebook.