Create a slide that provides a high-level overview of a SaaS product, including its value proposition, target audience, platform availability, business model, and key performance indicators (KPIs). The slide should be visually appealing and easy to understand, using clear language and concise bullet points. The KPIs should include the MVP timeline, activation lift, and current NPS. The slide should also include a title and brief explanatory notes for each section. Design the slide for a presentation to potential investors or stakeholders.
Start with the one-sentence value prop: we are a collaborative customer insights hub that converts support and product feedback into prioritized roadmaps in real time.
Clarify who this is for: product managers, CX leaders, and growth teams at SaaS companies.
Show where it lives: web-first with native iOS and Android apps for on-the-go triage and reviews.
Explain how we make money: SaaS, seat-based pricing with monthly and annual plans.
Move to the right side and set expectations: a 12-week MVP timeline to validate core workflows.
Highlight traction goal: targeting a +38% activation lift by simplifying onboarding and using in-product prompts.
Close with quality signal: aiming for an NPS of 42 at MVP by tightening feedback loops and shipping weekly improvements.
Behind the Scenes
How AI generated this slide
Establish the slide layout with a title section and a main content area split into two columns.
Populate the left column with textual project details like the product's one-liner, target audience, platforms, and business model, utilizing bullet points for clarity.
Develop the right column to visually showcase key performance metrics (KPIs) with animated counters for MVP timeline (weeks), activation lift (percentage), and current NPS (numerical score).
Implement animations for each element's entrance to enhance engagement and visual appeal. Apply consistent branding and color scheme for visual cohesion.
Refine text content for conciseness and impact, ensuring it effectively conveys the project's core information to the target audience (investors/stakeholders).
Why this slide works
This slide effectively communicates a comprehensive project overview, balancing textual information with visually engaging KPI presentations. The clear structure and animation enhance audience understanding and engagement. SEO keywords such as SaaS, product management, customer experience, KPIs, and business models are integrated within the content for better searchability and relevance.
Slide Code
You need to be logged in to view the slide code.
Frequently Asked Questions
What is the purpose of this slide?
This slide provides a concise overview of a SaaS product's key aspects, including its value proposition, target audience, platform availability, business model, and target KPIs, tailored for investor or stakeholder presentations. It's designed to quickly and effectively convey essential project information.
How do the animations enhance the slide?
The entrance animations for each element, especially the dynamic counters for the KPIs, add visual interest and highlight important metrics. This approach makes the presentation more engaging and memorable for the audience, contributing to a more compelling presentation of the project.
Create a title slide for a presentation about React.js in 2025. The title should be 'React.js in 2025 — A Pragmatic Deep Dive'. The slide should have an ambient, dark background with subtle animations, possibly including a stylized atom-like graphic, faded progress bar (0/20), a minimalist design and dark theme. The title should appear after the background animation has settled in. The subtitle should include the speaker’s name, the event name, and the timestamp. The overall tone should be professional and forward-looking, emphasizing practical application over hype.
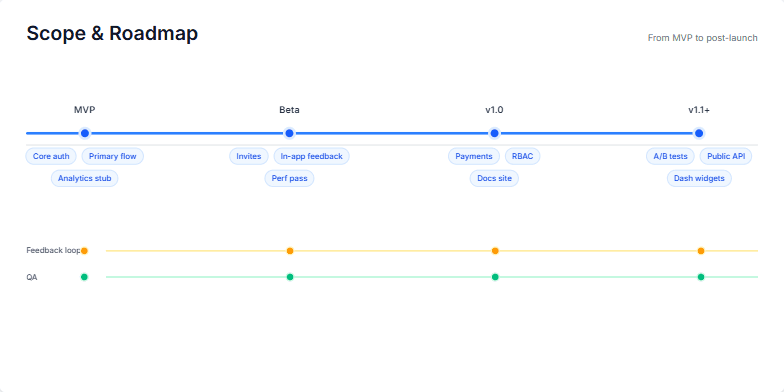
Create a slide visualizing a product roadmap from MVP to post-launch. The roadmap should highlight key milestones (MVP, Beta, v1.0, v1.1+) and their respective deliverables. Visually represent the timeline with a progress bar and milestones as distinct points. Each milestone should list its key deliverables (e.g., MVP: Core auth, Primary flow, Analytics stub). Include visual cues for continuous feedback and QA throughout the roadmap. The slide should have a clean, professional design suitable for a business presentation. The title should be 'Scope & Roadmap' with a subtitle 'From MVP to post-launch'. The overall tone should be pragmatic, emphasizing a clear timeline and continuous improvement.
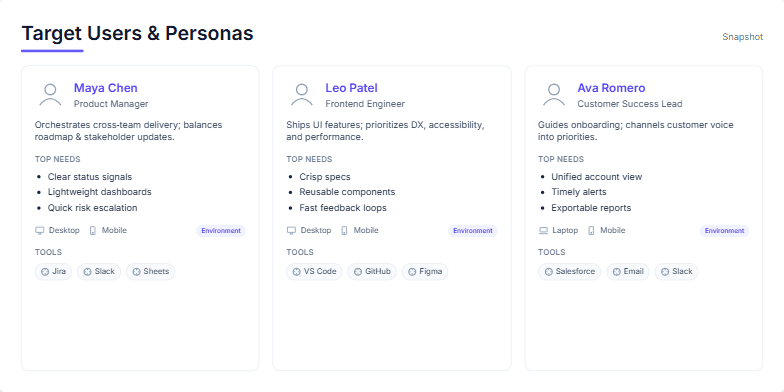
This slide showcases the key target user personas for our product. It helps to understand their roles, needs, working environments, and the tools they utilize. By focusing on these personas, we can better tailor our product development and marketing strategies. The slide features three distinct personas, each with detailed descriptions and visual representations, allowing for a comprehensive overview of our target audience segments and their diverse requirements.
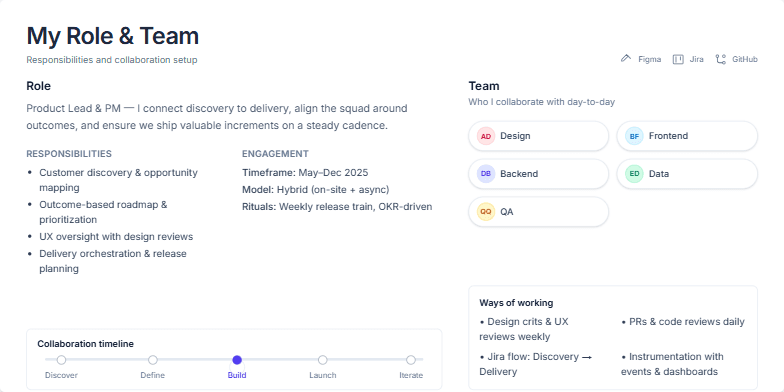
Create a slide about my role as a Product Lead and PM, my responsibilities, the team I work with, our ways of working, and the tools we use. Highlight my focus on connecting discovery to delivery, aligning the team around outcomes, and ensuring valuable increments are shipped on a steady cadence. Include details about the project timeframe, working model (hybrid), and rituals (weekly release train, OKR-driven). Visualize the collaboration timeline with phases like Discover, Define, Build, Launch, and Iterate. Emphasize the importance of a clear path and shared understanding of quality at each step.
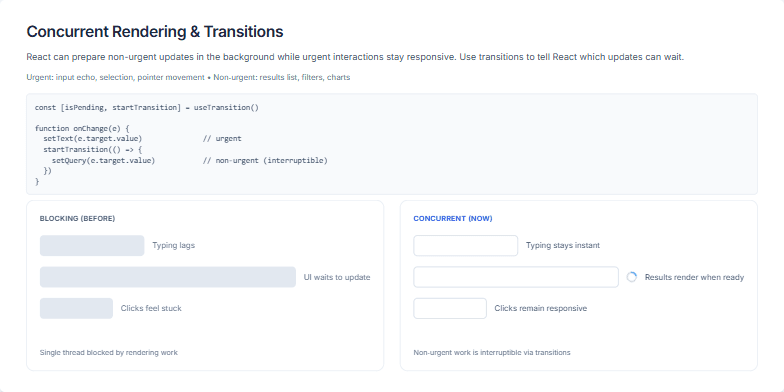
This slide explains how React's concurrent rendering feature helps maintain a smooth and responsive user interface during intensive updates. It contrasts the old blocking rendering behavior, where long updates would freeze the UI, with the new concurrent approach. With concurrent rendering, urgent updates like text input and user interactions are prioritized while non-urgent updates, such as rendering large lists or complex charts, are handled in the background without blocking the main thread. The slide visually illustrates the difference between the two approaches and provides a code example demonstrating the use of `useTransition` to mark non-urgent updates. This allows developers to improve the user experience by ensuring that the application remains responsive even during complex operations.
Create a slide visualizing the transformation of JSX code into its compiled JavaScript equivalent. The slide should emphasize that JSX is not a runtime feature but syntax sugar processed by tooling. It should have two code blocks side-by-side, one for JSX and one for compiled JavaScript. Use syntax highlighting to visually represent the code elements. Animate the slide to sequentially highlight corresponding parts of the JSX and its compiled counterpart. Start by highlighting the tags (e.g., 'h1'), then props (e.g., 'className', 'name'), and finally, children. Aim for a modern JSX runtime output. The title should be 'JSX to JavaScript: What Actually Runs', with a subtitle 'Tooling handles the transform'. The initial state should have opacity 0 and y-offset 8, animating to opacity 1 and y-offset 0. The code should include a functional component example, demonstrating the conversion.
Want to generate your own slides with AI?
Start creating high-tech, AI-powered presentations with Slidebook.