Create a slide visualizing the tech stack and architecture for a web application. The frontend uses React, TypeScript, Vite, and Tailwind CSS. The backend is built with Node.js and NestJS, using a REST API. PostgreSQL is the database, accessed via Prisma. Authentication is handled with OAuth2, JWT, and Auth0. PostHog is used for analytics. The CI/CD pipeline involves GitHub Actions, Docker, and Fly.io. The architecture diagram should show the client (React SPA), API (NestJS REST), and database (PostgreSQL). It should also highlight integrations with Stripe and SendGrid, emphasizing that these external services interact with the API, not directly with the client or database. The flow should be clearly illustrated: Client → API → Database, with integrations decoupled and accessible through the API.
Start by setting the scene: this is our high-level tech stack and how pieces fit together.
Walk the left column from top to bottom as badges fade in: Frontend is React with TypeScript, built with Vite and styled with Tailwind.
Next, the Backend: Node.js with NestJS exposing a clean REST API.
Database layer: PostgreSQL with Prisma for type-safe data access.
Auth choices: OAuth2 and JWT, with Auth0 as the identity provider.
Analytics via PostHog for product telemetry.
CI/CD: GitHub Actions builds and tests; images via Docker; deploys run on Fly.io.
Shift to the right diagram as tiers slide in: Client at the top, API in the middle, Database at the bottom, separated with thin lines to keep it simple.
Point out the Integrations column: Stripe for payments and SendGrid for email, connected minimally to the API tier. Emphasize that external services hang off the API, keeping the client thin and the database isolated.
Close by reinforcing the flow: Client → API → Database, with integrations decoupled and accessed through the API.
Behind the Scenes
How AI generated this slide
Analyze the provided tech stack and architecture details.
Structure the slide layout: split view with categories on the left and architecture diagram on the right.
Design visual elements: icons for categories, boxes for tiers, arrows for flow.
Implement animations: fade-in for categories, slide-in for tiers, arrow transition.
Optimize layout for clarity and visual appeal: grid system, spacing, font sizes.
Why this slide works
This slide effectively communicates the tech stack and architecture of a web application. The clear categorization of technologies on the left provides a quick overview of the chosen tools. The architecture diagram on the right visually represents the system's structure and data flow. The animations enhance engagement and highlight the relationships between components. Using distinct visual elements, like icons and color-coded boxes, improves readability and understanding. The use of motion adds a dynamic element, guiding the viewer's attention through the presented information. Furthermore, the slide adheres to web development best practices by emphasizing the decoupling of external services through API interaction. Overall, the slide is well-structured, visually appealing, and effectively conveys complex technical information in an accessible manner. This approach caters to both technical and non-technical audiences, enabling a shared understanding of the project's underlying technologies and architectural design. Keywords: web application architecture, tech stack visualization, React, Node.js, PostgreSQL, API, CI/CD, frontend, backend, database, integrations, animation, data flow, visualization.
Slide Code
You need to be logged in to view the slide code.
Frequently Asked Questions
What is the purpose of this slide?
This slide provides a clear and concise overview of the technology stack and architecture used in the web application. It visually represents the different components, their relationships, and the flow of data within the system. This is beneficial for both technical and non-technical audiences, fostering a shared understanding of the project's underlying technologies and design principles. Keywords: tech stack, architecture, visualization, web application, data flow.
What are the key technologies used in this application?
The frontend utilizes React, TypeScript, Vite, and Tailwind CSS. The backend is built with Node.js and NestJS, employing a REST API. PostgreSQL serves as the database, accessed through Prisma. Authentication is handled via OAuth2, JWT, and Auth0. PostHog provides analytics. The CI/CD pipeline incorporates GitHub Actions, Docker, and Fly.io. Keywords: React, TypeScript, Vite, Tailwind CSS, Node.js, NestJS, REST API, PostgreSQL, Prisma, OAuth2, JWT, Auth0, PostHog, GitHub Actions, Docker, Fly.io, frontend, backend, database, authentication, analytics, CI/CD.
How does the architecture diagram illustrate the flow of data?
The diagram visually depicts the flow of data as Client → API → Database. It highlights that external services, such as Stripe and SendGrid, interact exclusively with the API layer. This decoupling keeps the client thin and the database isolated, enhancing security and maintainability. Keywords: architecture diagram, data flow, API, client, database, integrations, decoupling, security, maintainability.
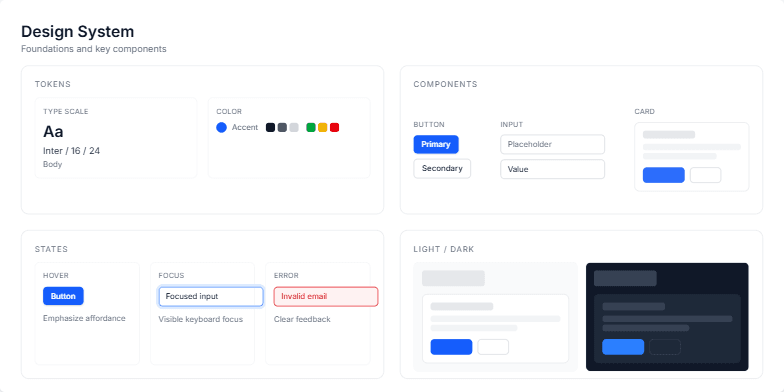
Create a slide showcasing a design system, including tokens (typography, color), components (button, input, card), states (hover, focus, error), and light/dark mode previews. The slide should have a title 'Design System' with a subtitle 'Foundations and key components'. The design system uses Inter font with size 16 and line height 24 for the body text. The primary color is blue. Include speaker notes explaining the design system's purpose to reduce decision fatigue and speed up delivery while maintaining quality. Also, explain how tokens, components, states, and themes work together. The layout should be clean and informative, suitable for a presentation.
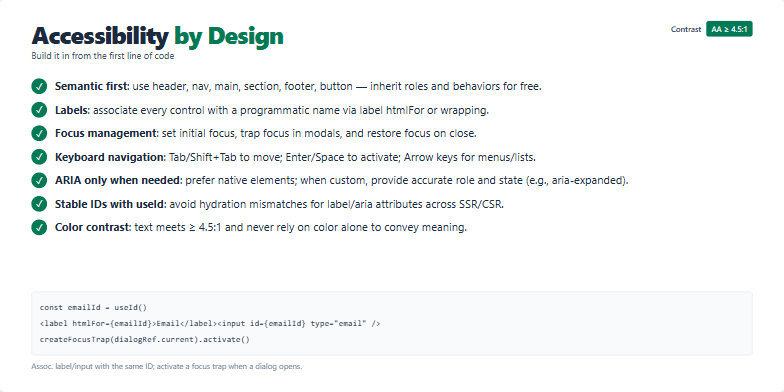
Create a slide about building accessible web applications from the ground up. The slide should emphasize practical techniques and best practices for incorporating accessibility into the development process. It should cover topics like semantic HTML, proper labeling, focus management, keyboard navigation, and ARIA attributes. The target audience is web developers, and the tone should be informative and encouraging. Include a code example demonstrating best practices for associating labels with inputs and managing focus traps.
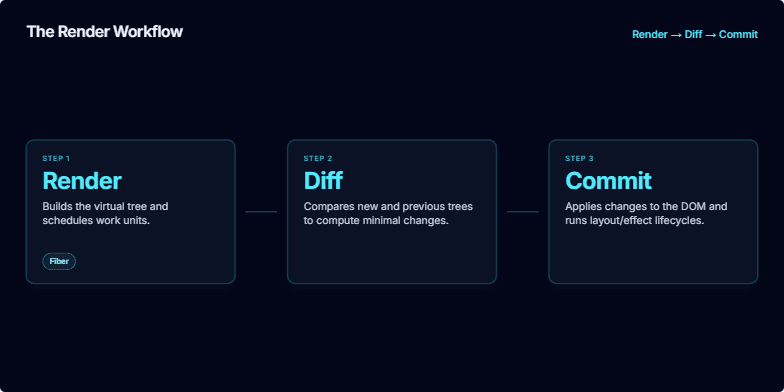
Create a slide explaining the render workflow in React, including the render, diff, and commit phases. It should be visually appealing and easy to understand. The slide should also include speaker notes explaining the process in more detail, highlighting the Fiber architecture for cooperative scheduling and how it impacts rendering performance. It should also mention the importance of this mental model for debugging. The target audience are developers who have some understanding of React.
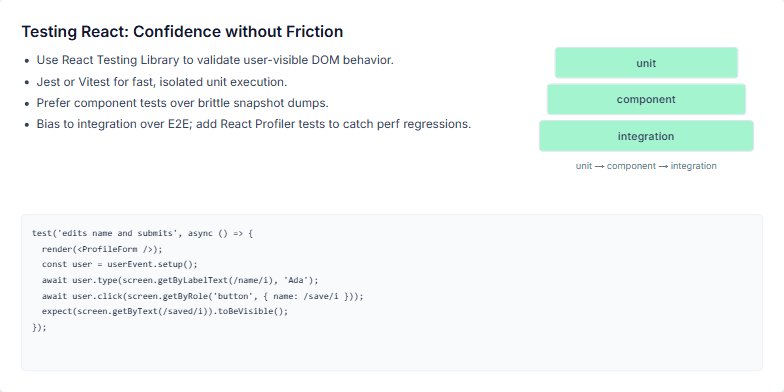
This slide is part of a presentation on testing React applications effectively. It emphasizes the importance of finding a balance between confidence and development speed. The slide content focuses on using practical tools and techniques like React Testing Library, Jest/Vitest, and component/integration tests over brittle snapshot tests. It also highlights the need for performance regression testing using React Profiler. The visual aid uses a pyramid to represent the testing layers: unit, component, and integration, emphasizing a focus on component and integration tests for optimal results. Finally, a code example demonstrates a typical test using React Testing Library, emphasizing its simplicity and focus on user interaction and visible outcomes.
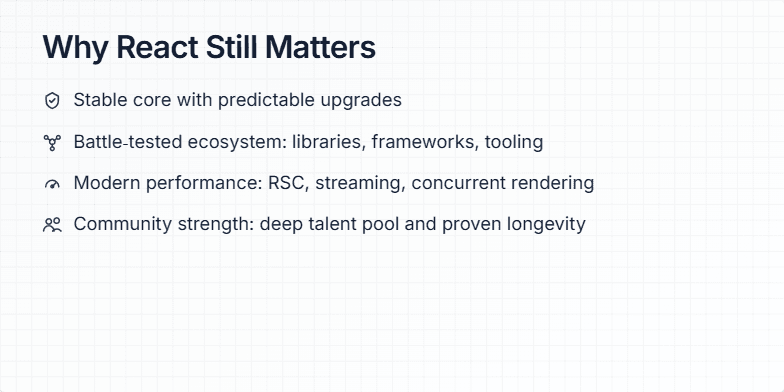
Create a slide explaining why React is still a relevant and powerful JavaScript framework for front-end development in 2024. Highlight its key strengths, including stability, ecosystem, performance, and community, while acknowledging its maturity. The slide should be visually appealing and engaging for a technical audience familiar with web development concepts.
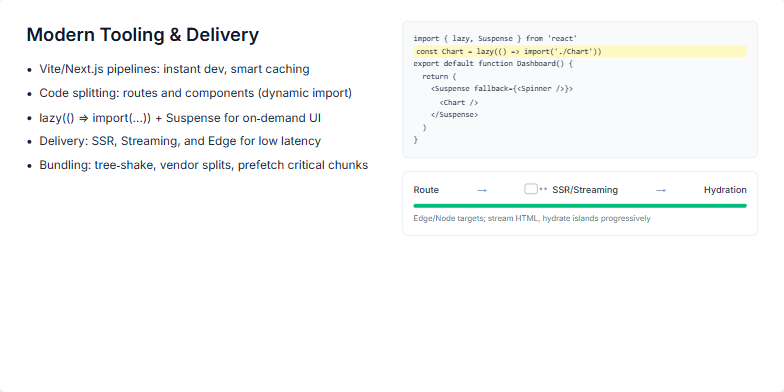
This slide focuses on explaining how modern web development tools and delivery techniques contribute to faster and more efficient user experiences. It covers the use of Vite and Next.js for optimized development pipelines, including features like Hot Module Replacement (HMR) and smart caching. The core concept of code-splitting, both at the route and component level, is highlighted, with a specific emphasis on dynamic imports and React's lazy() function combined with Suspense for on-demand loading of UI elements. The delivery aspect is also explored, covering SSR, streaming, and edge rendering for low latency, and touching upon bundling strategies like tree-shaking, vendor chunk splitting, and critical path prefetching to improve metrics like Time To First Byte (TTFB) and Time To Interactive (TTI). The slide also aims to visually showcase code examples demonstrating the use of lazy() and Suspense alongside a diagram illustrating the flow from routing to hydration, highlighting the progressive nature of modern web experiences.
Want to generate your own slides with AI?
Start creating high-tech, AI-powered presentations with Slidebook.