A comparative analysis of Gen Z and Millennial attitudes towards social causes and brand alignment.
Description provided by the user:
I'm creating a presentation for a marketing team about consumer behavior. I need a slide that compares Gen Z and Millennials on their engagement with social and civic issues. It should start by highlighting their shared values, such as climate and diversity. Then, it needs to visually contrast their expectations from brands using specific data points. Please create a clean, modern design with a chart that clearly shows how the two generations differ on metrics like expecting brand action, researching brands, and their readiness to boycott.
Start by framing the common ground: both cohorts care about climate, diversity and inclusion, and equity. Point to the three chips so the audience sees the shared priorities first.
Then contrast what moves each group. For Gen Z, emphasize that they expect brands to take visible action and to be authentically aligned with the cause. For Millennials, highlight that they respond to solid cause marketing programs and clear transparency around impact.
Shift to the right side indicators. Explain that each line animates in, and the two markers show where each cohort tends to land relative to the other.
Walk through the three lines: Expect action — Gen Z skews higher. Research brands — both do it, with Gen Z slightly ahead. Boycott readiness — Gen Z is more ready to walk away when values are misaligned.
Close by tying this to execution: lead with authentic action for Gen Z; pair transparent reporting and credible cause programs for Millennials.
Behind the Scenes
How AI generated this slide
First, I'll structure the slide using a two-column grid layout to separate the qualitative context from the quantitative data, creating a balanced and easy-to-follow narrative.
Next, I'll establish a clear visual identity for each cohort, assigning sky blue to Gen Z and amber to Millennials. This color-coding will be used consistently across descriptive elements and the data chart for immediate recognition.
Then, I'll design a custom 'MetricLine' component to function as an animated dumbbell chart. This visualization is ideal for directly comparing the two generational data points on a single axis for metrics like 'Expect action' and 'Boycott readiness'.
Finally, I'll implement a staged animation sequence using Framer Motion and Fragments. This will reveal the slide's content progressively, guiding the audience's focus from the overarching topic to the specific data insights, making the information more digestible and impactful.
Why this slide works
This slide excels by effectively translating complex consumer behavior data into a clear, digestible, and visually engaging narrative. The two-column layout logically separates the 'why' (shared values) from the 'how' (specific behaviors), guiding the audience through a compelling story. The use of a consistent color-coding scheme and a custom animated dumbbell chart makes the data comparison intuitive and memorable. The strategic use of staged animations via Framer Motion prevents information overload and allows the presenter to control the pacing, ensuring that key insights about generational marketing, brand activism, and consumer expectations land with maximum impact.
Slide Code
You need to be logged in to view the slide code.
Frequently Asked Questions
Why is this type of generational comparison important for marketing strategy?
Understanding the nuanced differences between consumer cohorts like Gen Z and Millennials is critical for effective marketing strategy. While they may share high-level values like sustainability and diversity, their expectations for brand involvement differ significantly. This slide shows that Gen Z expects tangible action and authenticity, while Millennials may be more responsive to transparent cause marketing. Tailoring messaging, campaigns, and corporate social responsibility initiatives to these distinct motivational drivers allows brands to build stronger, more authentic connections, foster loyalty, and avoid alienating key demographics.
What is the purpose of the staged animations in the slide?
The staged animations serve a crucial storytelling function. By revealing information in a deliberate sequence, the slide guides the audience's focus and builds a narrative. First, it establishes common ground (shared values), then it introduces the distinct cohorts, and finally, it presents the comparative data. This progressive reveal prevents the audience from being overwhelmed by data upfront. It allows the presenter to explain each piece of information in context, making the final data points more impactful and the overall message about consumer behavior and brand strategy much easier to understand and remember.
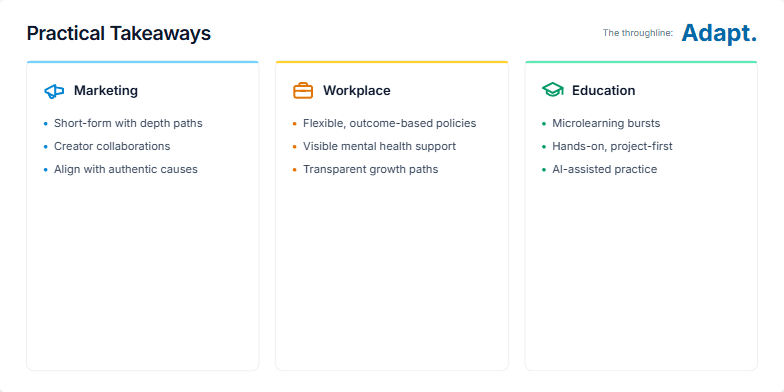
I need a summary slide that presents actionable takeaways for adapting to modern trends. Please structure it into three distinct columns: Marketing, Workplace, and Education. Each column should feature a relevant icon and three concise bullet points outlining key strategies. The overall design should be clean and professional, with a clear title. A crucial element is to have a final, overarching theme that ties all the points together, revealed at the end of the animation sequence. The central theme should be 'Adapt.'
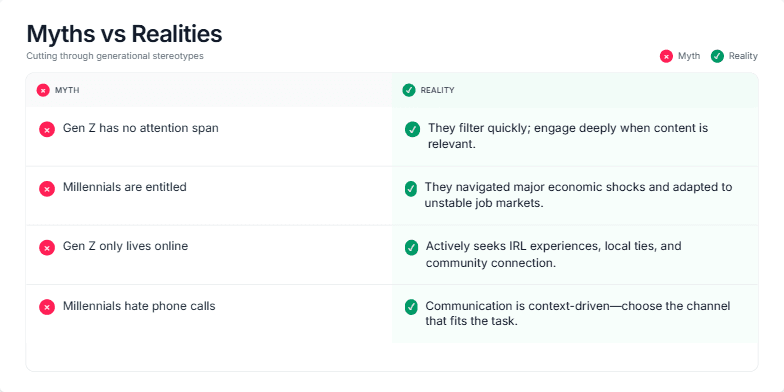
I need a presentation slide for a business or marketing strategy meeting. The slide should tackle common generational stereotypes, specifically about Gen Z and Millennials. I want a 'Myths vs. Realities' format presented in a clean, professional two-column table. Use a red 'X' icon for myths and a green checkmark '✓' for realities. The design should be modern and engaging, with a clear title and a legend. Each myth/reality pair should be revealed one by one to keep the audience focused. Please include four examples: two for Gen Z (attention span, online life) and two for Millennials (entitlement, communication preferences).
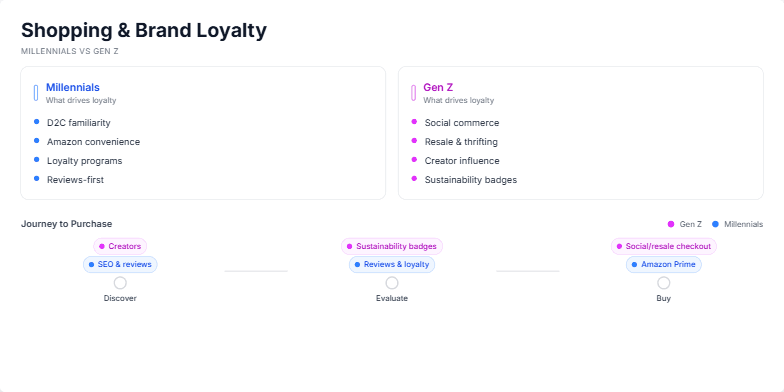
The user requested a slide that visually compares the consumer habits of two key demographics: Millennials and Gen Z. The goal was to create a clear, data-driven presentation slide for a marketing or business strategy meeting. The slide needed to break down what drives brand loyalty for each group and then map out their distinct paths to purchase, from discovery to the final transaction. The design should be modern, easy to understand at a glance, and use color-coding to differentiate the two cohorts, ultimately highlighting the need for tailored marketing strategies.
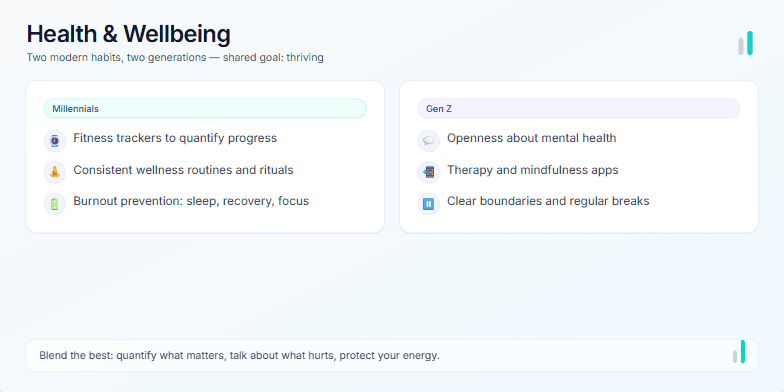
Create a presentation slide that compares the health and wellness habits of Millennials versus Gen Z. The design should be clean, modern, and professional. Use a two-column layout to present the distinct approaches of each generation. For Millennials, focus on themes like fitness tracking, structured routines, and burnout prevention. For Gen Z, highlight their focus on mental health, digital therapy tools, and setting boundaries. Include a title, a brief subtitle, and a concluding summary that suggests a blended approach is best. Add subtle animations to make the slide engaging, and include some decorative elements that fit the health theme.
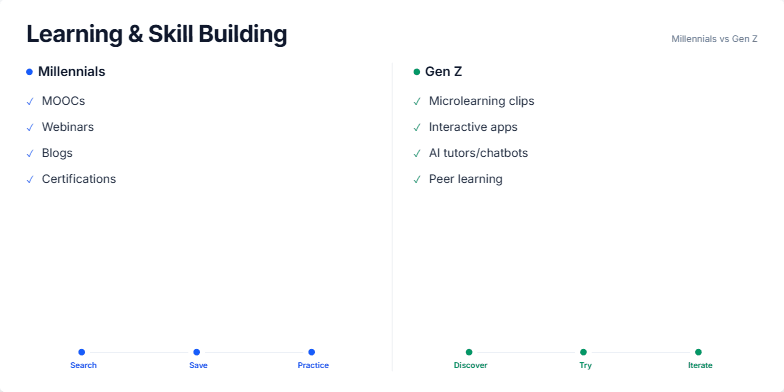
Create a presentation slide that compares the learning and skill-building preferences of two distinct generations: Millennials and Gen Z. The slide should be structured as a side-by-side comparison. For each generation, list their preferred learning methods (e.g., MOOCs for Millennials, microlearning for Gen Z). Additionally, illustrate the typical process or workflow each generation follows when learning, such as 'Search, Save, Practice' for one and 'Discover, Try, Iterate' for the other. Use distinct color schemes to visually separate the two groups and make the comparison clear and easy to follow.
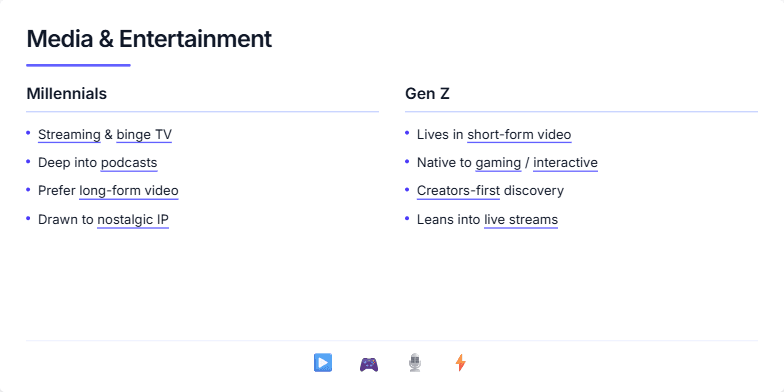
I need a presentation slide that compares the media and entertainment consumption habits of Millennials and Gen Z. Please create a clean, modern design with a two-column layout for a direct side-by-side comparison. For Millennials, highlight their preference for streaming, binge-watching, podcasts, and long-form content. For Gen Z, focus on their immersion in short-form video, gaming, creator-led content, and live streams. Use animations to reveal the points sequentially to guide the audience's focus. Conclude with a visual summary using icons that represent the key media types discussed.
Want to generate your own slides with AI?
Start creating high-tech, AI-powered presentations with Slidebook.