Generational Approaches to Health & Wellbeing: A Comparison of Millennial and Gen Z Habits
Description provided by the user:
Create a presentation slide that compares the health and wellness habits of Millennials versus Gen Z. The design should be clean, modern, and professional. Use a two-column layout to present the distinct approaches of each generation. For Millennials, focus on themes like fitness tracking, structured routines, and burnout prevention. For Gen Z, highlight their focus on mental health, digital therapy tools, and setting boundaries. Include a title, a brief subtitle, and a concluding summary that suggests a blended approach is best. Add subtle animations to make the slide engaging, and include some decorative elements that fit the health theme.
Open by framing the slide: Health and wellbeing are shared goals, but the paths differ by generation.
Point to the header pulse bars as a decorative heartbeat—this isn’t data, just a subtle cue for energy and balance.
Walk the left column: Millennials lean on fitness trackers, build steady routines, and focus on preventing burnout through recovery.
Shift to the right column: Gen Z normalizes mental health conversations, embraces therapy and mindfulness apps, and sets firmer boundaries with intentional breaks.
Close with the bottom prompt: a blended approach works best—measure what helps, talk openly, and protect time and energy.
Behind the Scenes
How AI generated this slide
First, establish the core theme: comparing Millennial and Gen Z health habits. I'll structure this with a clear title, subtitle, and a two-column layout for direct comparison, which is ideal for this type of data storytelling.
Next, design the visual aesthetic using Tailwind CSS. A soft gradient background provides a calm, modern feel. I'll create a reusable `ColumnCard` React component to display each generation's points, ensuring code consistency and reusability. I'll assign distinct accent colors—teal for Millennials and violet for Gen Z—to create a clear visual separation.
Then, populate the cards with specific, relatable habits for each generation, using emojis as icons (e.g., '⌚' for trackers, '💬' for mental health conversations) to make the information scannable and visually engaging.
After that, I'll integrate Framer Motion to add subtle animations. Each major section of the slide (header, columns, footer) will fade and slide in sequentially using `<Fragment>` components. This controlled animation guides the audience's focus and enhances the presentation flow.
To add thematic polish, I'll include small, looping animated bars that resemble a heartbeat or an audio visualizer. This reinforces the 'wellbeing' theme without distracting from the core information.
Finally, I'll create a summary bar at the bottom with a frosted-glass effect (`backdrop-blur`) to deliver the key takeaway—blending the best of both approaches—and write detailed speaker notes to guide the presenter through each point on the slide.
Why this slide works
This slide is effective because it uses a clear and balanced two-column structure to present a comparative analysis, which is highly effective for information retention. The component-based approach in React with props for `title`, `items`, and `accent` makes the code clean, scalable, and easy to maintain. The strategic use of Framer Motion for staggered animations creates a professional and engaging user experience, guiding the viewer's eye through the content logically. The visual design is modern and appealing, employing a soft color palette, ample whitespace, and thematic decorative elements (the pulsing bars) that enhance the 'wellbeing' topic. The concluding summary provides a clear, actionable takeaway, making the slide not just informative but also impactful.
Slide Code
You need to be logged in to view the slide code.
Frequently Asked Questions
What is the primary difference in wellness approaches between Millennials and Gen Z shown on the slide?
The primary difference highlighted is the focus. Millennials are depicted as leaning towards quantifiable physical health and performance optimization, using tools like fitness trackers and focusing on structured routines to prevent burnout. In contrast, Gen Z is shown to prioritize mental and emotional wellbeing, normalizing conversations about mental health, utilizing digital tools like therapy apps, and enforcing stricter boundaries to protect their energy.
How does the slide's design support its message?
The slide's design uses a clean, structured two-column layout to make the comparison between the two generations immediately clear. Distinct accent colors (teal and violet) visually separate the two groups, reducing cognitive load. The use of simple emojis as icons makes the points more scannable and relatable. Furthermore, the subtle animations guide the viewer's attention sequentially, building the narrative from the introduction to the final conclusion, reinforcing the story being told.
What is the purpose of the animated bars in the design?
The animated, pulsing vertical bars are a decorative visual element. They are designed to subtly evoke the concept of a heartbeat, vital signs, or energy levels, which directly relates to the slide's central theme of 'Health & Wellbeing'. This adds a dynamic, thematic touch that enhances visual interest without distracting from the main informational content.
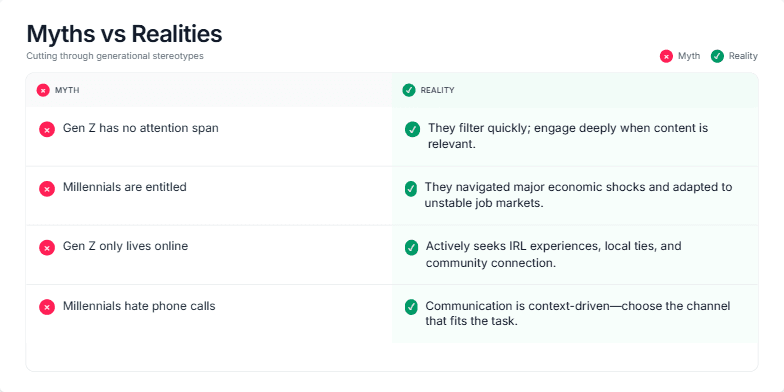
I need a presentation slide for a business or marketing strategy meeting. The slide should tackle common generational stereotypes, specifically about Gen Z and Millennials. I want a 'Myths vs. Realities' format presented in a clean, professional two-column table. Use a red 'X' icon for myths and a green checkmark '✓' for realities. The design should be modern and engaging, with a clear title and a legend. Each myth/reality pair should be revealed one by one to keep the audience focused. Please include four examples: two for Gen Z (attention span, online life) and two for Millennials (entitlement, communication preferences).
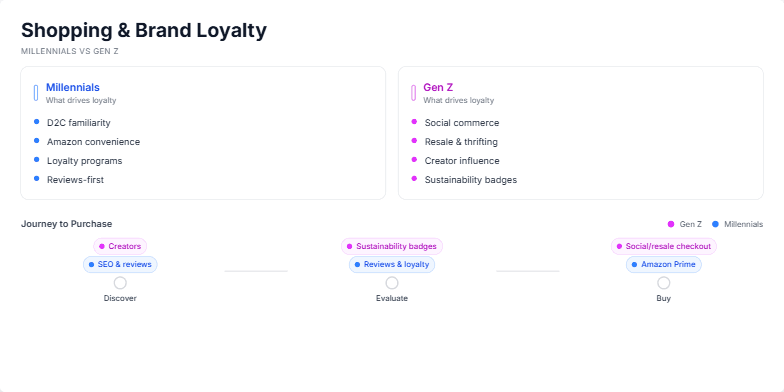
The user requested a slide that visually compares the consumer habits of two key demographics: Millennials and Gen Z. The goal was to create a clear, data-driven presentation slide for a marketing or business strategy meeting. The slide needed to break down what drives brand loyalty for each group and then map out their distinct paths to purchase, from discovery to the final transaction. The design should be modern, easy to understand at a glance, and use color-coding to differentiate the two cohorts, ultimately highlighting the need for tailored marketing strategies.
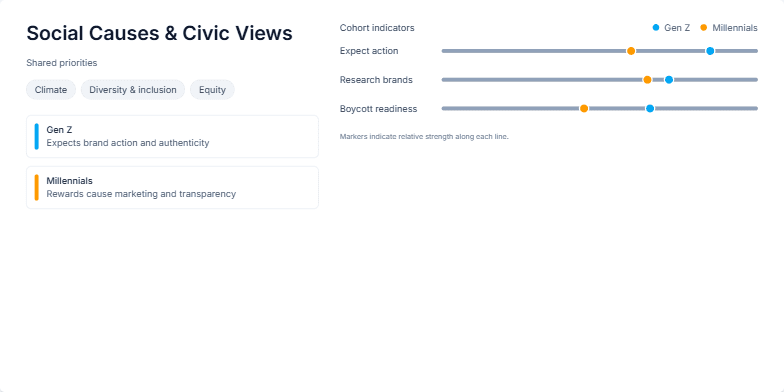
I'm creating a presentation for a marketing team about consumer behavior. I need a slide that compares Gen Z and Millennials on their engagement with social and civic issues. It should start by highlighting their shared values, such as climate and diversity. Then, it needs to visually contrast their expectations from brands using specific data points. Please create a clean, modern design with a chart that clearly shows how the two generations differ on metrics like expecting brand action, researching brands, and their readiness to boycott.
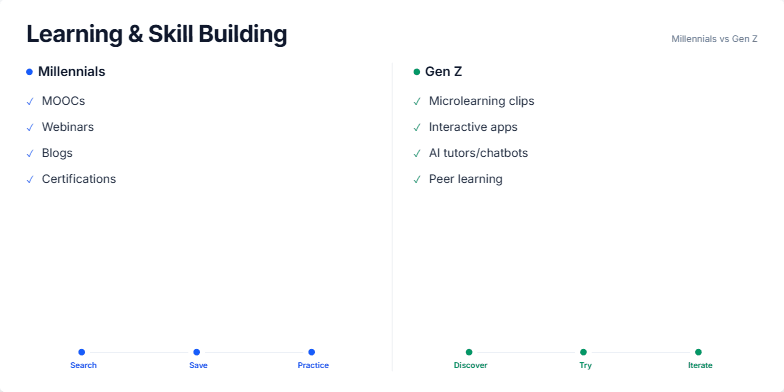
Create a presentation slide that compares the learning and skill-building preferences of two distinct generations: Millennials and Gen Z. The slide should be structured as a side-by-side comparison. For each generation, list their preferred learning methods (e.g., MOOCs for Millennials, microlearning for Gen Z). Additionally, illustrate the typical process or workflow each generation follows when learning, such as 'Search, Save, Practice' for one and 'Discover, Try, Iterate' for the other. Use distinct color schemes to visually separate the two groups and make the comparison clear and easy to follow.
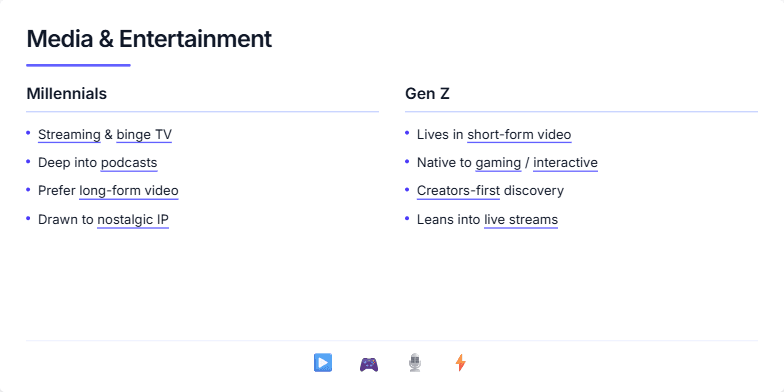
I need a presentation slide that compares the media and entertainment consumption habits of Millennials and Gen Z. Please create a clean, modern design with a two-column layout for a direct side-by-side comparison. For Millennials, highlight their preference for streaming, binge-watching, podcasts, and long-form content. For Gen Z, focus on their immersion in short-form video, gaming, creator-led content, and live streams. Use animations to reveal the points sequentially to guide the audience's focus. Conclude with a visual summary using icons that represent the key media types discussed.
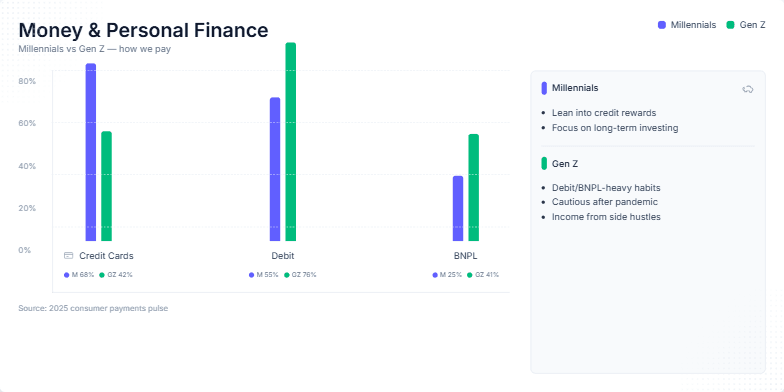
Generate a data-driven slide that compares the financial behaviors of Millennials and Gen Z. The core of the slide should be an animated bar chart visualizing their usage of different payment methods: Credit Cards, Debit, and Buy Now, Pay Later (BNPL). Use distinct colors to represent each generation. Beside the chart, include a 'notes' panel that summarizes key insights and behavioral traits for each demographic, such as investment focus for Millennials and debit-heavy habits for Gen Z. The overall design should be clean, professional, and suitable for a business presentation on consumer finance trends. Include speaker notes to guide the presenter.
Want to generate your own slides with AI?
Start creating high-tech, AI-powered presentations with Slidebook.