Welcome the audience and introduce the theme: a clear, fair comparison between Gen Z and Millennials.
Point to the clean aesthetic and the single accent color to signal a balanced, data-first conversation.
Explain that today we will frame differences through context: economy, tech eras, and cultural touchpoints.
Outline the categories we will compare: values, work styles, communication, technology habits, and money.
Hint that the lightbulb stands for ideas and innovation; the chat bubble represents dialogue and empathy.
Set expectations: no stereotypes—focus on patterns with nuance and actionable takeaways for 2025.
Open by reading the title: “Who Is Who—Birth Years and Ages.” Set the intent: we’re aligning on definitions.
Reveal Millennials first. Say: Millennials are born 1981 to 1996, which puts them at ages 29 to 44 in 2025.
Reveal Gen Z next. Say: Gen Z follows, born 1997 to 2012, now ages 13 to 28.
Bring up the timeline. Point out the two spans: Millennials ending in 1996 and Gen Z starting in 1997—clean handoff across adjacent periods.
Close with the nuance note: these are tendencies, not absolutes—there will always be overlap in behaviors and life stages.
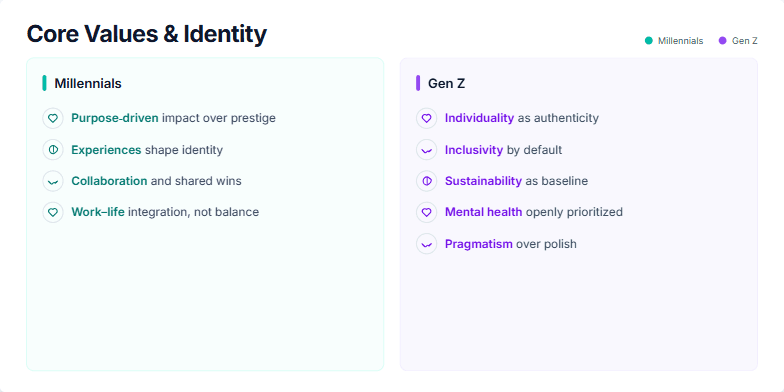
We’re contrasting core values shaping identity across two cohorts.
On the left: Millennials. Emphasize purpose-driven impact, choosing experiences that define who they are, a strong preference for collaborative teams, and the idea of work–life integration rather than strict separation.
On the right: Gen Z. Highlight individuality as authenticity, inclusivity as a default setting, sustainability as a baseline expectation, mental health as openly prioritized, and a pragmatic lens—what works beats what looks polished.
Point out the shared human thread—the handshake—where collaboration and inclusion meet. The takeaway: design products, rituals, and policies that let both groups see themselves—and work together—without compromise.
Start by framing the question: how do Millennials and Gen Z differ in their everyday device habits?
Point out the color legend: slate for Millennials, indigo for Gen Z.
Reveal the chart. Read it left to right:
Laptops: Millennials higher, reflecting work and productivity anchors.
Tablets: Both lower, but Millennials still ahead for browsing and casual media.
Phones: Gen Z dominates, topping the chart.
Introduce the first callout: Multi-device. Emphasize Millennials’ balance between laptops and phones, with tablets still in the mix.
Then highlight Mobile-first for Gen Z. Underscore that the phone is their primary gateway—communication, media, and tasks converge there.
Land on Short-form creation. Connect Gen Z’s phone dominance to vertical video, quick edits, and instant publishing.
Close with the implication: optimize for seamless cross-device experiences for Millennials and prioritize fast, mobile-native flows for Gen Z.
Set the frame: we’re contrasting two axes—discovery versus curation, and communities versus networks.
First row, Millennials: Facebook for groups and events—organizing and staying in touch through known networks.
Instagram for visual curation—highlight reels and crafted identity.
LinkedIn for career networking—professional identity and opportunity flow.
YouTube for how-to—deeper learning and tutorials.
Second row, Gen Z: TikTok for algorithmic discovery—content finds you.
Snapchat for streaks and close friends—ephemeral, intimate connection.
YouTube mixes long and short—attention can stretch when the value is clear.
Discord for community servers—persistent, participatory spaces.
Land the point: product design mirrors behavior. Plan content by asking—are we fueling discovery or curation, and are we building communities or networks?
I’ll set the scene with the title: Communication Preferences, and briefly explain we’re comparing Millennials and Gen Z, side by side.
Next, I’ll walk the audience through the left column. For Millennials: they’re comfortable with email and Slack, use texts and emojis for quick check-ins, and will pick up the phone when it’s necessary.
Then I’ll shift to the right column: Gen Z leads with DMs and chat, communicates with short videos and voice notes, tends to avoid email, and prefers async, concise replies.
I’ll point out the thin icons as quick visual anchors: envelope for email, chat bubble for DMs/texts, phone for calls, and camera for short video.
I’ll close by highlighting the practical takeaway: match channel and tone to the audience—lean async and concise for Gen Z; keep email/Slack and occasional calls for Millennials.
Open by framing the slide: we are comparing two cohorts’ work and career expectations and where they lean on workplace location.
- Highlight Millennials first: emphasize their desire for growth and mentorship, flexibility, strong mission alignment, and clear leadership tracks.
- Move to Gen Z: underline their emphasis on stability and wellbeing, salary transparency, flexible schedules, and skills-first hiring over pedigree.
- Transition to the meter: explain it as a simple view of workplace preference. The fill shows stronger pull toward Remote/Hybrid overall.
- Point to the dots: Millennials lean remote/hybrid but slightly closer to center; Gen Z leans even more toward remote/hybrid. Note that both cohorts still value in-person moments, but default to flexibility.
- Close with the implication: design policies that mix growth paths and mentorship with flexibility and transparent, skills-based practices.
Open by framing the story: two cohorts, same goal—pay smartly—but different tools.
Introduce the chart and legend. Explain the three categories: Credit Cards, Debit, BNPL.
Step 1: Reveal bars. Call out credit cards: Millennials at about two-thirds, Gen Z lower.
Step 2: Debit rises for Gen Z; BNPL is also higher for Gen Z than Millennials.
Transition to the notes panel: summarize behaviors.
- Millennials: chase credit rewards, think long-term investing.
- Gen Z: prefer debit and BNPL, cautious post-pandemic, diversify with side hustles.
Close with implication: tailor products and guidance—rewards plus credit-building for Millennials, budgeting and responsible BNPL for Gen Z.
Set the frame: we are comparing how Millennials and Gen Z consume media, side by side.
Start with Millennials: emphasize their comfort with streaming platforms, binge behavior, and affinity for podcasts.
Highlight their patience for long-form video and the pull of nostalgic IP that revives familiar franchises.
Shift to Gen Z: they live in short-form feeds, see gaming and interactivity as default, and follow creators over channels.
Underline the real-time habit with live streams and the participatory expectation.
Close by mapping formats to icons: play for streaming, controller for gaming, mic for podcasts/creators, lightning for live, fast-moving moments.
Tie it back to strategy: choose format and cadence by audience—depth for Millennials, immediacy and interactivity for Gen Z.
Introduce the slide as a clear split: two audiences, one goal—building skills effectively.
Left side: Millennials tend to pursue structured, credentialed learning. Call out MOOCs and webinars for depth, blogs for ongoing insight, and certifications for formal validation.
Right side: Gen Z leans into immediacy and interactivity—microlearning clips for speed, interactive apps for engagement, AI tutors or chatbots for just-in-time help, and peer learning for social reinforcement.
Now highlight the verbs. Millennials flow is Search, Save, Practice—they gather, bookmark, and then apply. Gen Z is Discover, Try, Iterate—jump in quickly, test, and refine.
Close by suggesting design implications: support both paths. Provide searchable libraries and playlisting for the Search and Save crowd, and bite-sized challenges with instant feedback and AI nudges for those who want to Try and Iterate.
Open by framing the slide: Health and wellbeing are shared goals, but the paths differ by generation.
Point to the header pulse bars as a decorative heartbeat—this isn’t data, just a subtle cue for energy and balance.
Walk the left column: Millennials lean on fitness trackers, build steady routines, and focus on preventing burnout through recovery.
Shift to the right column: Gen Z normalizes mental health conversations, embraces therapy and mindfulness apps, and sets firmer boundaries with intentional breaks.
Close with the bottom prompt: a blended approach works best—measure what helps, talk openly, and protect time and energy.
Start by framing the common ground: both cohorts care about climate, diversity and inclusion, and equity. Point to the three chips so the audience sees the shared priorities first.
Then contrast what moves each group. For Gen Z, emphasize that they expect brands to take visible action and to be authentically aligned with the cause. For Millennials, highlight that they respond to solid cause marketing programs and clear transparency around impact.
Shift to the right side indicators. Explain that each line animates in, and the two markers show where each cohort tends to land relative to the other.
Walk through the three lines: Expect action — Gen Z skews higher. Research brands — both do it, with Gen Z slightly ahead. Boycott readiness — Gen Z is more ready to walk away when values are misaligned.
Close by tying this to execution: lead with authentic action for Gen Z; pair transparent reporting and credible cause programs for Millennials.
Title: Introduce the slide as Shopping and Brand Loyalty, contrasting Millennials and Gen Z.
First, point to the left column. Explain Millennials’ loyalty drivers: familiarity with D2C brands, reliance on Amazon’s convenience, engagement with loyalty programs, and a reviews-first mindset.
Next, move to the right column. Describe Gen Z’s patterns: native to social commerce, comfort with resale and thrifting, strong creator influence, and attention to sustainability badges.
Then, walk through the journey line from left to right: Discover, Evaluate, Buy.
Discover: Gen Z leans on creators; Millennials skew toward search and reviews.
Evaluate: Gen Z looks for sustainability signals; Millennials dig into reviews and loyalty benefits.
Buy: Gen Z is comfortable with social or resale checkout; Millennials default to Amazon and Prime convenience.
Close by emphasizing that loyalty hooks must surface at the right stage for each cohort, and that aligning channel and proof points to the journey step lifts conversion.
Open by reframing: this isn’t about calling out generations—it’s about replacing lazy myths with useful reality.
Point to the header: the red X marks a myth, the green check marks a reality. We’ll reveal each pair in sequence.
First: “Gen Z has no attention span.” Clarify that Gen Z rapidly filters noise but invests when something matters; design for relevance and depth.
Second: “Millennials are entitled.” Reframe with context—many launched careers during recessions and upheaval; resilience shaped expectations.
Third: “Gen Z only lives online.” Emphasize their desire for in-person connection and community; hybrid, not digital-only.
Fourth: “Millennials hate phone calls.” It’s not avoidance—it’s choosing the best medium for the job; align channel with urgency and nuance.
Close with a takeaway: build strategies around behaviors and context, not stereotypes.
Open by framing this as a concise, actionable set of takeaways across three domains.
- Point to Marketing: emphasize short-form as the hook with clear paths to deeper content, leverage creator collaborations for trust, and ensure campaigns align with authentic causes.
- Move to Workplace: advocate for flexibility focused on outcomes, normalize visible mental health support, and clarify growth paths so people know how to advance.
- Close with Education: promote microlearning for momentum, prioritize hands-on projects, and use AI to give immediate practice and feedback.
Conclude by revealing the word “Adapt.” and underscore that adaptability is the common thread across all three columns.