Comparing Millennial and Gen Z Work and Career Expectations in the Modern Workplace
Description provided by the user:
I need a presentation slide to analyze and compare the work and career expectations of two key demographics: Millennials and Gen Z. The slide should be structured to present a clear side-by-side comparison. Please create two distinct sections with bullet points outlining the primary career priorities for each generation. Visually, I want a clean and professional design. It's important to also include a data visualization, like a horizontal bar or a meter, that shows the overall preference for remote/hybrid work versus traditional on-site roles. Use a color scheme, maybe teal and violet, to differentiate the two groups. Finally, please provide comprehensive speaker notes to guide the presenter in explaining the data, the generational differences, and the key takeaways for business leaders.
Open by framing the slide: we are comparing two cohorts’ work and career expectations and where they lean on workplace location.
Highlight Millennials first: emphasize their desire for growth and mentorship, flexibility, strong mission alignment, and clear leadership tracks.
Move to Gen Z: underline their emphasis on stability and wellbeing, salary transparency, flexible schedules, and skills-first hiring over pedigree.
Transition to the meter: explain it as a simple view of workplace preference. The fill shows stronger pull toward Remote/Hybrid overall.
Point to the dots: Millennials lean remote/hybrid but slightly closer to center; Gen Z leans even more toward remote/hybrid. Note that both cohorts still value in-person moments, but default to flexibility.
Close with the implication: design policies that mix growth paths and mentorship with flexibility and transparent, skills-based practices.
Behind the Scenes
How AI generated this slide
The initial prompt was analyzed to identify the core components: a comparative analysis of Millennial and Gen Z work expectations, a two-column list format, a data visualization for remote vs. on-site preference, and a color-coded scheme.
A clean layout was structured with a prominent title, followed by a two-column grid using CSS Flexbox for the generational lists. This ensures a clear, readable comparison of career priorities.
Researched and populated the lists with key characteristics defining each cohort's professional outlook. For Millennials, the focus was on growth, mentorship, and purpose. For Gen Z, it was on stability, transparency, and skills-based opportunities.
A horizontal 'preference meter' was designed to visualize the 72% vs. 28% split in workplace preference. The Framer Motion library was used to add a subtle animation to the bar, making the data reveal more engaging for the audience.
A simple legend was created below the meter to associate the brand colors (teal and violet) with the corresponding generations (Millennials and Gen Z), ensuring the slide is easy to interpret.
Speaker notes were crafted to provide a narrative flow, guiding the presenter from a high-level introduction to a detailed breakdown of each section and concluding with actionable insights for talent management and HR strategy.
Why this slide works
This slide is effective because it presents complex information in a highly digestible format. The side-by-side comparison allows for immediate understanding of the nuances between Millennial and Gen Z career expectations. The animated data visualization provides a powerful, memorable summary of workplace location preferences, a key topic in today's business environment. The consistent color-coding enhances clarity and brand cohesion. This design is highly valuable for HR professionals, team leaders, and executives involved in talent acquisition, employee retention, and shaping corporate culture, as it provides clear insights into generational differences in the workplace and supports data-driven decision-making for a more inclusive and productive work environment.
Slide Code
You need to be logged in to view the slide code.
Frequently Asked Questions
What is the key takeaway from the preference meter on the slide?
The primary takeaway is that a significant majority (72%) of the modern workforce, represented by Millennials and Gen Z, prefers remote or hybrid work arrangements over being fully on-site. While both generations contribute to this trend, the speaker notes suggest Gen Z has an even stronger preference for it. This data highlights the critical need for companies to build flexible work policies to attract and retain top talent from these demographic cohorts.
How do 'mission alignment' for Millennials and 'stability and wellbeing' for Gen Z differ?
While related, they represent a subtle shift in priorities. 'Mission alignment' for Millennials often means seeking purpose-driven work and feeling connected to a company's larger social or ethical goals. 'Stability and wellbeing' for Gen Z, shaped by economic uncertainty and a greater awareness of mental health, focuses more on job security, predictable income, clear boundaries, and comprehensive benefits that support a healthy work-life balance. Essentially, Millennials seek purpose from the work, while Gen Z seeks security through the work.
How can our company use this information to improve our recruitment strategy?
To appeal to both generations, your recruitment strategy should be multifaceted. For Millennials, emphasize career development programs, mentorship opportunities, and your company's mission and values in job descriptions and interviews. For Gen Z, lead with salary transparency by including ranges in job postings, highlight your company's commitment to employee wellbeing and mental health benefits, and implement a skills-first hiring process that values practical abilities over traditional credentials alone. Offering flexible and hybrid work options will be a powerful tool to attract both groups.
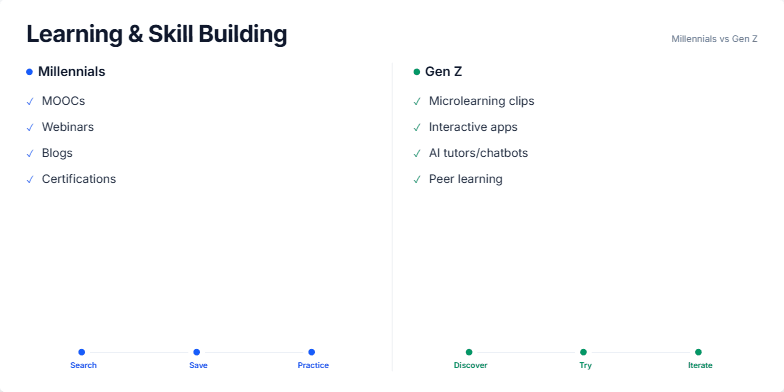
Create a presentation slide that compares the learning and skill-building preferences of two distinct generations: Millennials and Gen Z. The slide should be structured as a side-by-side comparison. For each generation, list their preferred learning methods (e.g., MOOCs for Millennials, microlearning for Gen Z). Additionally, illustrate the typical process or workflow each generation follows when learning, such as 'Search, Save, Practice' for one and 'Discover, Try, Iterate' for the other. Use distinct color schemes to visually separate the two groups and make the comparison clear and easy to follow.
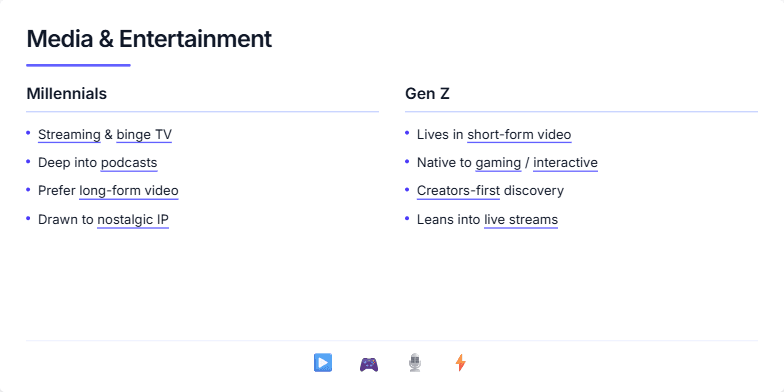
I need a presentation slide that compares the media and entertainment consumption habits of Millennials and Gen Z. Please create a clean, modern design with a two-column layout for a direct side-by-side comparison. For Millennials, highlight their preference for streaming, binge-watching, podcasts, and long-form content. For Gen Z, focus on their immersion in short-form video, gaming, creator-led content, and live streams. Use animations to reveal the points sequentially to guide the audience's focus. Conclude with a visual summary using icons that represent the key media types discussed.
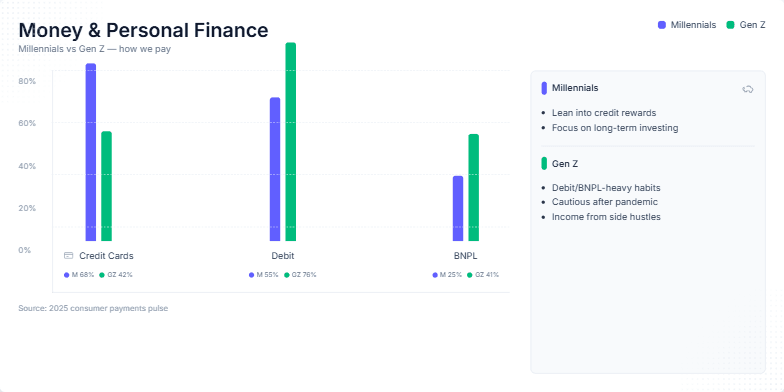
Generate a data-driven slide that compares the financial behaviors of Millennials and Gen Z. The core of the slide should be an animated bar chart visualizing their usage of different payment methods: Credit Cards, Debit, and Buy Now, Pay Later (BNPL). Use distinct colors to represent each generation. Beside the chart, include a 'notes' panel that summarizes key insights and behavioral traits for each demographic, such as investment focus for Millennials and debit-heavy habits for Gen Z. The overall design should be clean, professional, and suitable for a business presentation on consumer finance trends. Include speaker notes to guide the presenter.
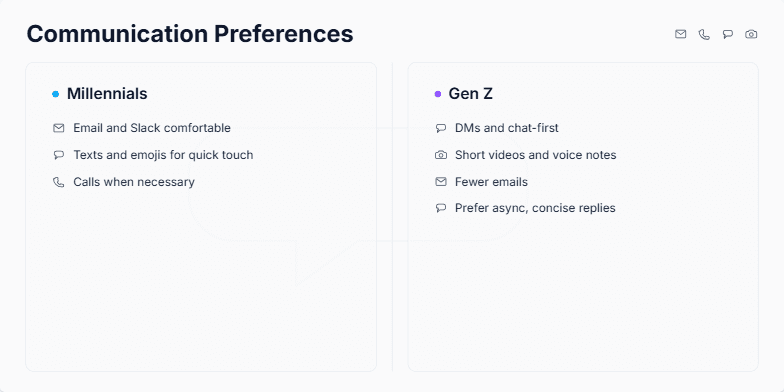
This slide was generated to visually compare the distinct communication styles of two major generations in the workforce: Millennials and Gen Z. The goal is to provide a clear, side-by-side breakdown for managers, team leads, or HR professionals. It highlights the primary channels each generation prefers, from email and calls for Millennials to DMs and short-form video for Gen Z. The slide is designed to be part of a larger presentation on improving internal communication strategies, fostering better team collaboration, and understanding generational diversity in a professional setting.
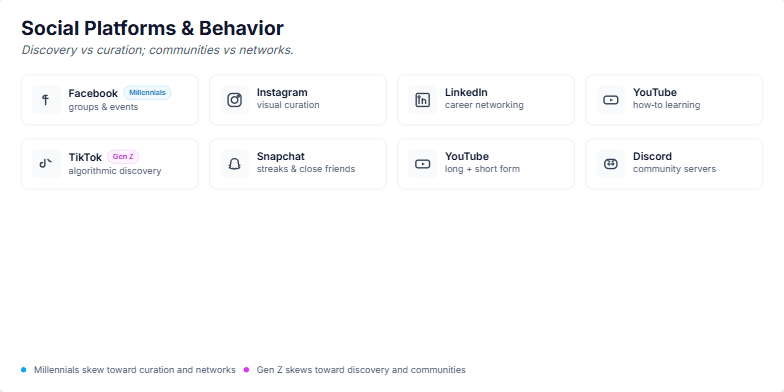
I need a slide that visually compares the social media platform preferences and behaviors of Millennials versus Gen Z. The central theme should be the contrast between two key axes: discovery versus curation, and communities versus networks. Please create two distinct rows, one for each generation. For Millennials, include Facebook, Instagram, LinkedIn, and YouTube, highlighting their use for curation and networking. For Gen Z, include TikTok, Snapchat, YouTube, and Discord, emphasizing their preference for algorithmic discovery and community building. Use icons for each platform and a clean, professional design.
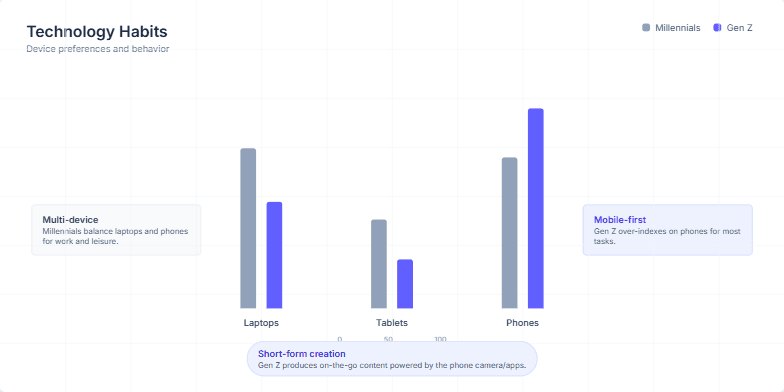
The user requested a presentation slide to visually compare the technology and device preferences of two key demographics: Millennials and Gen Z. The goal was to use a clear data visualization, specifically a clustered bar chart, to show the usage percentages for laptops, tablets, and phones. The slide needed to be animated to engage the audience and include summary callouts that interpret the data, highlighting the core behavioral differences like Millennials' multi-device usage versus Gen Z's mobile-first approach. The overall design was expected to be clean, modern, and easy to understand.
Want to generate your own slides with AI?
Start creating high-tech, AI-powered presentations with Slidebook.