A Comparative Analysis of Millennial and Gen Z Financial Habits and Payment Preferences
Description provided by the user:
Generate a data-driven slide that compares the financial behaviors of Millennials and Gen Z. The core of the slide should be an animated bar chart visualizing their usage of different payment methods: Credit Cards, Debit, and Buy Now, Pay Later (BNPL). Use distinct colors to represent each generation. Beside the chart, include a 'notes' panel that summarizes key insights and behavioral traits for each demographic, such as investment focus for Millennials and debit-heavy habits for Gen Z. The overall design should be clean, professional, and suitable for a business presentation on consumer finance trends. Include speaker notes to guide the presenter.
Open by framing the story: two cohorts, same goal—pay smartly—but different tools.
Introduce the chart and legend. Explain the three categories: Credit Cards, Debit, BNPL.
Step 1: Reveal bars. Call out credit cards: Millennials at about two-thirds, Gen Z lower.
Step 2: Debit rises for Gen Z; BNPL is also higher for Gen Z than Millennials.
Transition to the notes panel: summarize behaviors.
Gen Z: prefer debit and BNPL, cautious post-pandemic, diversify with side hustles.
Close with implication: tailor products and guidance—rewards plus credit-building for Millennials, budgeting and responsible BNPL for Gen Z.
Behind the Scenes
How AI generated this slide
First, the data for Millennial and Gen Z payment preferences is structured into a clear array of objects, defining categories like 'Credit Cards', 'Debit', and 'BNPL'.
Next, a reusable 'Bar' component is created using Framer Motion to animate the bars growing to their target height, providing a dynamic and engaging data reveal. This component is parameterized for value, color, and animation delay.
The main 'Chart' component is then constructed, which orchestrates the layout of the axes, labels, and the animated bars for each category and generation, ensuring data visualization best practices are followed.
A complementary 'NotesPanel' component is developed to present qualitative insights. It's also animated to appear after the chart, guiding the audience's focus from the quantitative data to the qualitative summary.
Finally, the entire slide is assembled, integrating the title, legend, chart, and notes panel into a cohesive layout. Decorative corner patterns are added using CSS for a polished visual finish, and comprehensive speaker notes are written to support the presentation narrative.
Why this slide works
This slide excels by effectively blending quantitative data visualization with qualitative analysis. The animated bar chart, powered by Framer Motion, makes the data engaging and easy to digest. The clear, consistent color-coding (indigo for Millennials, emerald for Gen Z) across the legend, chart, and notes panel creates a strong visual connection and reduces cognitive load. The layout is balanced and professional, with a clear information hierarchy that guides the viewer's eye from the main title to the chart and then to the summary insights. The inclusion of detailed speaker notes transforms it from a simple graphic into a complete storytelling tool, making it highly effective for presentations on finance, marketing, and business strategy.
Slide Code
You need to be logged in to view the slide code.
Frequently Asked Questions
What are the primary differences in payment methods between Millennials and Gen Z according to the chart?
The chart highlights distinct payment preferences. Millennials show a strong preference for Credit Cards at 68%, significantly higher than Gen Z's 42%. Conversely, Gen Z leads in the use of Debit cards (76% vs. 55% for Millennials) and Buy Now, Pay Later (BNPL) services (41% vs. 25% for Millennials). This data suggests Millennials are more integrated into the traditional credit ecosystem, likely focusing on rewards, while Gen Z prefers direct spending and modern, short-term financing options.
How can businesses use the insights from this slide to target these demographics?
Businesses can use these insights to tailor their financial products and marketing strategies. For Millennials, a focus on credit card rewards, loyalty programs, and long-term investment opportunities would be effective. For Gen Z, marketing should emphasize budgeting tools, the convenience of debit transactions, and responsible BNPL usage. Financial products that offer flexibility and address income from non-traditional sources like 'side hustles' would also resonate well with the Gen Z audience.
Why is there a significant gap in credit card usage between the two generations?
The gap in credit card usage can be attributed to several factors. Millennials, having entered the workforce earlier, have had more time to build credit history and have been targeted by credit card companies for longer. The notes also suggest they 'lean into credit rewards.' Gen Z, on the other hand, is described as 'cautious after pandemic,' which may translate to an aversion to potential debt. Their preference for Debit and BNPL reflects a desire for more direct control over their finances and transparent, manageable payment plans.
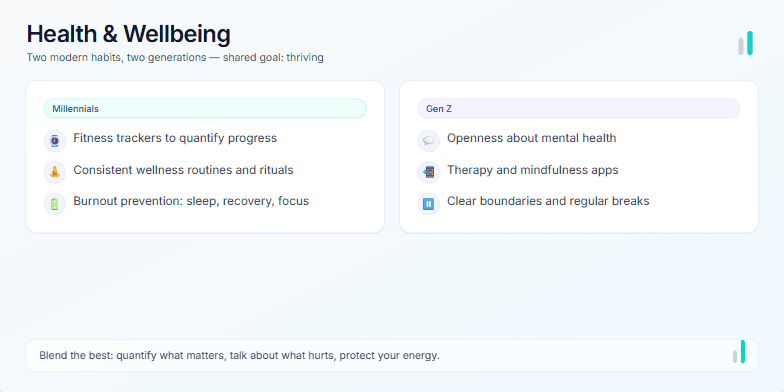
Create a presentation slide that compares the health and wellness habits of Millennials versus Gen Z. The design should be clean, modern, and professional. Use a two-column layout to present the distinct approaches of each generation. For Millennials, focus on themes like fitness tracking, structured routines, and burnout prevention. For Gen Z, highlight their focus on mental health, digital therapy tools, and setting boundaries. Include a title, a brief subtitle, and a concluding summary that suggests a blended approach is best. Add subtle animations to make the slide engaging, and include some decorative elements that fit the health theme.
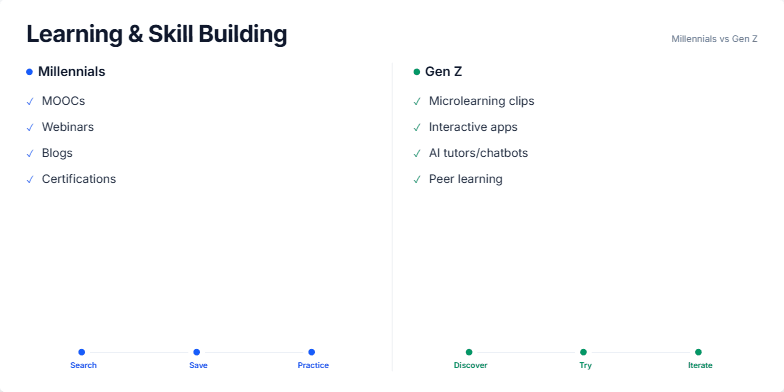
Create a presentation slide that compares the learning and skill-building preferences of two distinct generations: Millennials and Gen Z. The slide should be structured as a side-by-side comparison. For each generation, list their preferred learning methods (e.g., MOOCs for Millennials, microlearning for Gen Z). Additionally, illustrate the typical process or workflow each generation follows when learning, such as 'Search, Save, Practice' for one and 'Discover, Try, Iterate' for the other. Use distinct color schemes to visually separate the two groups and make the comparison clear and easy to follow.
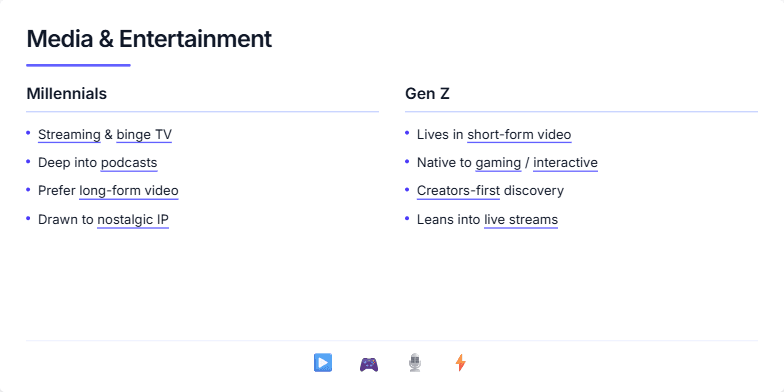
I need a presentation slide that compares the media and entertainment consumption habits of Millennials and Gen Z. Please create a clean, modern design with a two-column layout for a direct side-by-side comparison. For Millennials, highlight their preference for streaming, binge-watching, podcasts, and long-form content. For Gen Z, focus on their immersion in short-form video, gaming, creator-led content, and live streams. Use animations to reveal the points sequentially to guide the audience's focus. Conclude with a visual summary using icons that represent the key media types discussed.
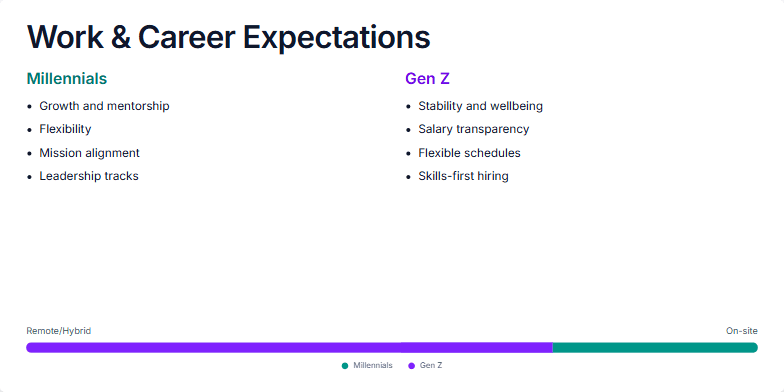
I need a presentation slide to analyze and compare the work and career expectations of two key demographics: Millennials and Gen Z. The slide should be structured to present a clear side-by-side comparison. Please create two distinct sections with bullet points outlining the primary career priorities for each generation. Visually, I want a clean and professional design. It's important to also include a data visualization, like a horizontal bar or a meter, that shows the overall preference for remote/hybrid work versus traditional on-site roles. Use a color scheme, maybe teal and violet, to differentiate the two groups. Finally, please provide comprehensive speaker notes to guide the presenter in explaining the data, the generational differences, and the key takeaways for business leaders.
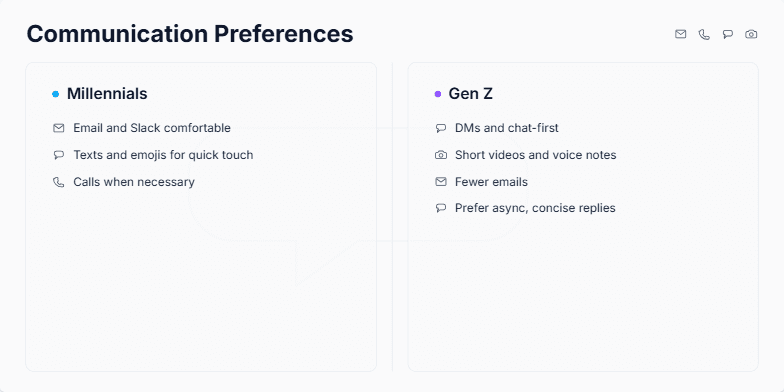
This slide was generated to visually compare the distinct communication styles of two major generations in the workforce: Millennials and Gen Z. The goal is to provide a clear, side-by-side breakdown for managers, team leads, or HR professionals. It highlights the primary channels each generation prefers, from email and calls for Millennials to DMs and short-form video for Gen Z. The slide is designed to be part of a larger presentation on improving internal communication strategies, fostering better team collaboration, and understanding generational diversity in a professional setting.
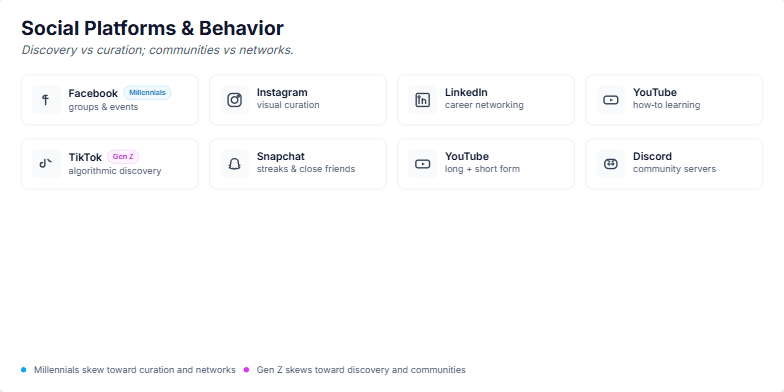
I need a slide that visually compares the social media platform preferences and behaviors of Millennials versus Gen Z. The central theme should be the contrast between two key axes: discovery versus curation, and communities versus networks. Please create two distinct rows, one for each generation. For Millennials, include Facebook, Instagram, LinkedIn, and YouTube, highlighting their use for curation and networking. For Gen Z, include TikTok, Snapchat, YouTube, and Discord, emphasizing their preference for algorithmic discovery and community building. Use icons for each platform and a clean, professional design.
Want to generate your own slides with AI?
Start creating high-tech, AI-powered presentations with Slidebook.