A Comparative Analysis of Millennial and Gen Z Communication Preferences in the Modern Workplace
Description provided by the user:
This slide was generated to visually compare the distinct communication styles of two major generations in the workforce: Millennials and Gen Z. The goal is to provide a clear, side-by-side breakdown for managers, team leads, or HR professionals. It highlights the primary channels each generation prefers, from email and calls for Millennials to DMs and short-form video for Gen Z. The slide is designed to be part of a larger presentation on improving internal communication strategies, fostering better team collaboration, and understanding generational diversity in a professional setting.
I’ll set the scene with the title: Communication Preferences, and briefly explain we’re comparing Millennials and Gen Z, side by side.
Next, I’ll walk the audience through the left column. For Millennials: they’re comfortable with email and Slack, use texts and emojis for quick check-ins, and will pick up the phone when it’s necessary.
Then I’ll shift to the right column: Gen Z leads with DMs and chat, communicates with short videos and voice notes, tends to avoid email, and prefers async, concise replies.
I’ll point out the thin icons as quick visual anchors: envelope for email, chat bubble for DMs/texts, phone for calls, and camera for short video.
I’ll close by highlighting the practical takeaway: match channel and tone to the audience—lean async and concise for Gen Z; keep email/Slack and occasional calls for Millennials.
Behind the Scenes
How AI generated this slide
The layout was structured as a two-column comparison to create a clear visual distinction between the two generational cohorts, which is a highly effective method for comparative analysis.
Custom SVG icon components (IconEnvelope, IconPhone, IconChat, IconCamera) were created to serve as quick visual signifiers for different communication methods, enhancing scannability and comprehension.
A reusable 'Column' component was engineered to display each generation's data, incorporating props for title, accent color, content items, and animation direction. This promotes code reusability and a consistent design.
Animations were integrated using Framer Motion and the slidebook 'Fragment' component. The title appears first, followed by the Millennial column sliding from the left, and then the Gen Z column from the right. This sequential reveal guides the audience's focus and makes the information more digestible.
A subtle, large chat bubble watermark was added in the background to reinforce the theme of communication without distracting from the main content, adding a layer of design sophistication.
Speaker notes were generated to provide a script for the presenter, detailing how to introduce the slide, walk through each column's points, and summarize the key takeaways for the audience.
Why this slide works
This slide is highly effective because it presents complex information in a simple, digestible, and visually engaging format. The side-by-side layout is a classic choice for comparison, making the differences between Millennial and Gen Z preferences immediately apparent. The use of minimalist icons and distinct accent colors (sky blue for Millennials, violet for Gen Z) helps differentiate the two groups and aids in information recall. The staggered animations, powered by Framer Motion, are not merely decorative; they strategically control the flow of information, preventing cognitive overload and directing the audience's attention step-by-step. The overall design is clean, professional, and modern, aligning with contemporary presentation aesthetics and ensuring the content is the hero.
Slide Code
You need to be logged in to view the slide code.
Frequently Asked Questions
What is the primary difference in communication styles shown on this slide?
The primary difference highlighted is the shift from formal, structured communication to informal, asynchronous methods. Millennials are comfortable with established digital channels like email (synchronous or asynchronous) and phone calls (synchronous). In contrast, Gen Z strongly prefers asynchronous, chat-first communication like DMs and leverages visual media like short videos and voice notes, often avoiding more formal channels like email.
How can a manager apply this information to lead a multi-generational team?
A manager can apply this by adopting a flexible, multi-channel communication strategy. For team-wide announcements, use a primary channel like Slack or email but be mindful of the tone. For individual feedback or check-ins with a Gen Z employee, a quick DM might be more effective than a formal email. For a Millennial employee, a scheduled call or a detailed email could be more appropriate. The key is to match the communication channel and style to the audience and the context of the message to improve engagement and clarity.
What does 'prefer async, concise replies' mean for Gen Z?
This means Gen Z values communication that doesn't require an immediate response, allowing them to reply on their own schedule. 'Asynchronous' (async) communication, like sending a DM or a voice note, respects their workflow and focus time. 'Concise' means they prefer messages that are short, to-the-point, and get the main idea across quickly, avoiding unnecessary jargon or lengthy paragraphs common in traditional corporate emails.
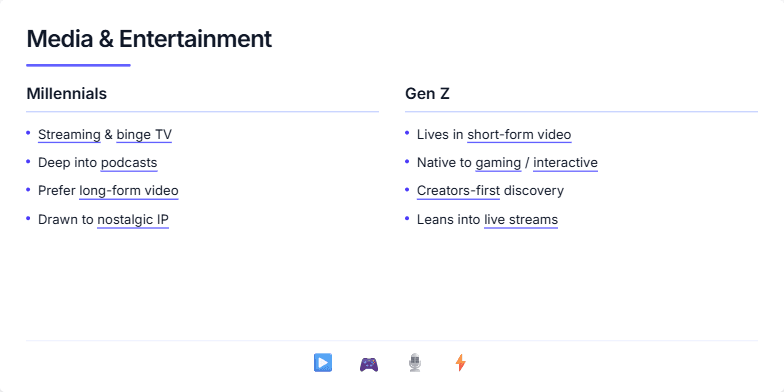
I need a presentation slide that compares the media and entertainment consumption habits of Millennials and Gen Z. Please create a clean, modern design with a two-column layout for a direct side-by-side comparison. For Millennials, highlight their preference for streaming, binge-watching, podcasts, and long-form content. For Gen Z, focus on their immersion in short-form video, gaming, creator-led content, and live streams. Use animations to reveal the points sequentially to guide the audience's focus. Conclude with a visual summary using icons that represent the key media types discussed.
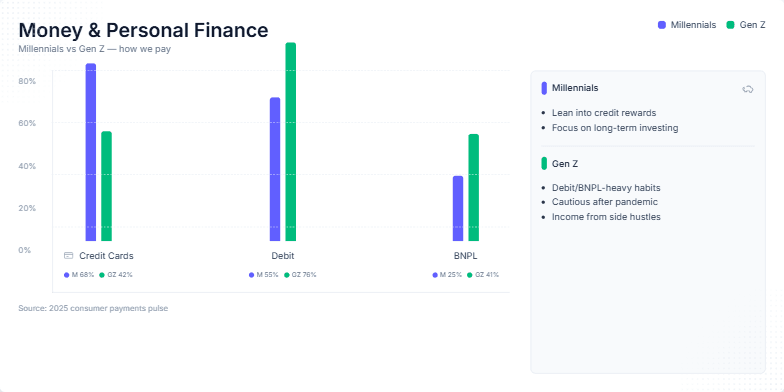
Generate a data-driven slide that compares the financial behaviors of Millennials and Gen Z. The core of the slide should be an animated bar chart visualizing their usage of different payment methods: Credit Cards, Debit, and Buy Now, Pay Later (BNPL). Use distinct colors to represent each generation. Beside the chart, include a 'notes' panel that summarizes key insights and behavioral traits for each demographic, such as investment focus for Millennials and debit-heavy habits for Gen Z. The overall design should be clean, professional, and suitable for a business presentation on consumer finance trends. Include speaker notes to guide the presenter.
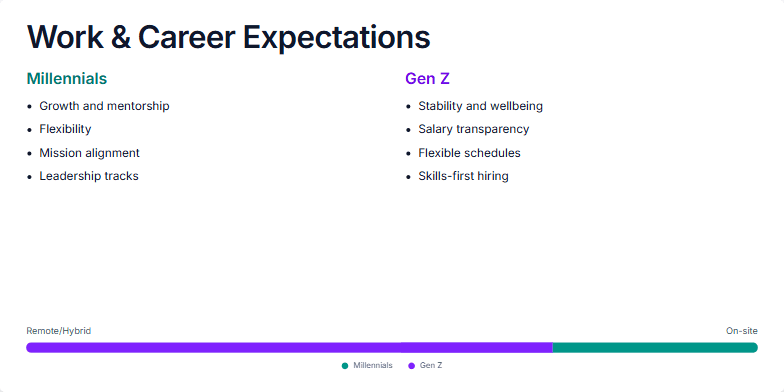
I need a presentation slide to analyze and compare the work and career expectations of two key demographics: Millennials and Gen Z. The slide should be structured to present a clear side-by-side comparison. Please create two distinct sections with bullet points outlining the primary career priorities for each generation. Visually, I want a clean and professional design. It's important to also include a data visualization, like a horizontal bar or a meter, that shows the overall preference for remote/hybrid work versus traditional on-site roles. Use a color scheme, maybe teal and violet, to differentiate the two groups. Finally, please provide comprehensive speaker notes to guide the presenter in explaining the data, the generational differences, and the key takeaways for business leaders.
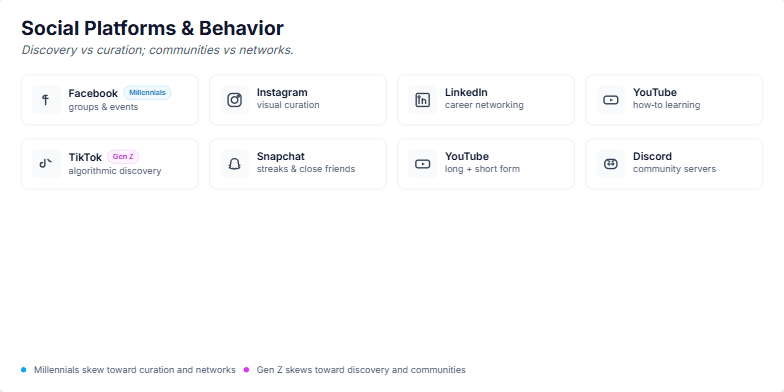
I need a slide that visually compares the social media platform preferences and behaviors of Millennials versus Gen Z. The central theme should be the contrast between two key axes: discovery versus curation, and communities versus networks. Please create two distinct rows, one for each generation. For Millennials, include Facebook, Instagram, LinkedIn, and YouTube, highlighting their use for curation and networking. For Gen Z, include TikTok, Snapchat, YouTube, and Discord, emphasizing their preference for algorithmic discovery and community building. Use icons for each platform and a clean, professional design.
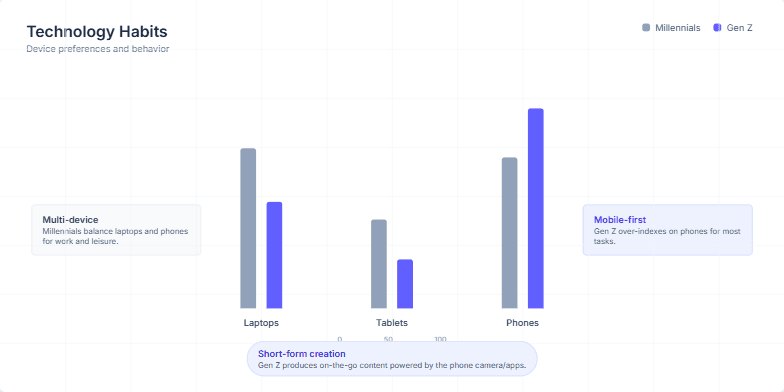
The user requested a presentation slide to visually compare the technology and device preferences of two key demographics: Millennials and Gen Z. The goal was to use a clear data visualization, specifically a clustered bar chart, to show the usage percentages for laptops, tablets, and phones. The slide needed to be animated to engage the audience and include summary callouts that interpret the data, highlighting the core behavioral differences like Millennials' multi-device usage versus Gen Z's mobile-first approach. The overall design was expected to be clean, modern, and easy to understand.
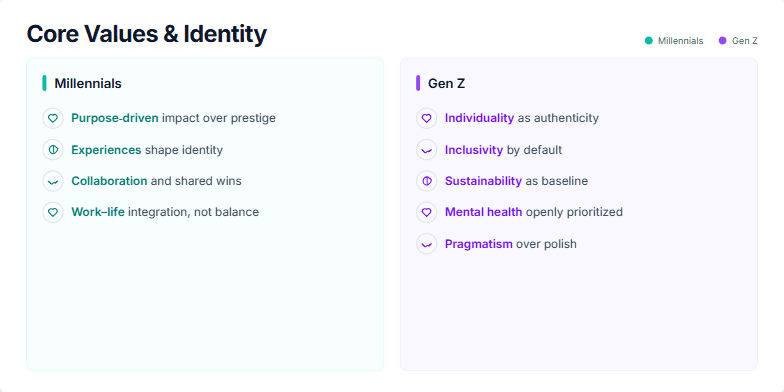
The user requested a presentation slide that visually compares the core values and identity-shaping principles of Millennials and Gen Z. The goal was to create a clear, side-by-side analysis for a business or marketing presentation. The prompt likely specified a two-column layout, with distinct color schemes to differentiate the two generations—teal for Millennials and violet for Gen Z. It would have included the specific value points for each group, such as "Purpose-driven impact" for Millennials and "Individuality as authenticity" for Gen Z. The user also required subtle animations for each point to enhance engagement and detailed speaker notes to guide the presenter.
Want to generate your own slides with AI?
Start creating high-tech, AI-powered presentations with Slidebook.