Defining Generations: A Clear Comparison of Millennial and Gen Z Birth Years and Age Ranges
Description provided by the user:
I need a presentation slide that clearly defines and compares the Millennial and Gen Z generations. The goal is to establish a shared understanding for a discussion on marketing or workplace trends. The slide should visually separate the two groups, displaying their respective birth year ranges (Millennials: 1981–1996, Gen Z: 1997–2012) and their corresponding age ranges in 2025. It should also include a simple timeline visualization to show how one generation follows the other. The design should be modern, clean, and professional, using subtle animations to present the information sequentially.
Open by reading the title: “Who Is Who—Birth Years and Ages.” Set the intent: we’re aligning on definitions.
Reveal Millennials first. Say: Millennials are born 1981 to 1996, which puts them at ages 29 to 44 in 2025.
Reveal Gen Z next. Say: Gen Z follows, born 1997 to 2012, now ages 13 to 28.
Bring up the timeline. Point out the two spans: Millennials ending in 1996 and Gen Z starting in 1997—clean handoff across adjacent periods.
Close with the nuance note: these are tendencies, not absolutes—there will always be overlap in behaviors and life stages.
Behind the Scenes
How AI generated this slide
First, the AI establishes a clear visual hierarchy with a main title, 'Who Is Who (Birth Years & Ages)', to immediately set the topic.
Next, it designs a reusable 'GenerationCard' component to present the core data for each generation. A two-column grid layout is chosen for a direct side-by-side comparison, which is a best practice for comparative data visualization.
A distinct color-coding scheme (sky blue for Millennials, violet for Gen Z) is implemented. This visual cue is consistently applied to cards, dots, and timeline bars to reinforce the distinction between the two groups and improve information recall.
To further visualize the timeline, a 'SpanBar' component is created. This element visually represents the time period each generation covers, clarifying their chronological relationship and the 'clean handoff' mentioned in the notes.
Finally, the AI integrates 'framer-motion' for subtle, professional entrance animations. Each piece of information is wrapped in a 'Fragment' component, allowing for a controlled, step-by-step reveal that syncs perfectly with the generated speaker notes, enhancing the storytelling and engagement of the presentation.
Why this slide works
This slide is highly effective because it translates demographic data into a clear, digestible, and visually engaging format. The use of a two-column layout and consistent color-coding simplifies the comparison between Millennials and Gen Z, reducing cognitive load for the audience. The combination of data cards for specific details and timeline bars for chronological context provides a multi-layered understanding of the topic. The inclusion of subtle animations via Framer Motion adds a professional polish that holds viewer attention and guides them through the information sequentially. By pairing these strong visual design principles with detailed, synchronized speaker notes, the slide becomes a comprehensive and powerful communication tool for any presentation on generational analysis, market research, or business strategy.
Slide Code
You need to be logged in to view the slide code.
Frequently Asked Questions
Why are these specific year ranges used for Millennials and Gen Z?
The birth year ranges used in the slide, 1981-1996 for Millennials and 1997-2012 for Gen Z, are based on the widely cited definitions from the Pew Research Center. While different researchers and organizations may use slightly different cutoffs, these ranges are a common standard in sociology, marketing, and demographic studies. They are defined by shared historical, technological, and social experiences that shape a generation's worldview. The key is to use a consistent definition for any analysis.
How do these generational definitions impact business and marketing strategies?
Understanding these generational cohorts is crucial for effective business and marketing strategy. These labels act as a shorthand for identifying large-scale shifts in consumer behavior, communication preferences, media consumption, and workplace expectations. For example, marketing to digitally native Gen Z often requires a focus on authenticity and social media platforms like TikTok, whereas strategies for Millennials might involve different channels and messaging related to life stages like homeownership and parenthood. The slide's note that these are 'tendencies, not absolutes' is vital; these are frameworks, not rigid boxes.
What generation comes after Gen Z?
The generation following Gen Z is commonly referred to as Generation Alpha. They are generally defined as individuals born from the early 2010s to the mid-2020s (approximately 2013 to 2025). As the first generation to be born entirely in the 21st century, their lives are deeply integrated with advanced technology, such as AI, smart devices, and highly personalized digital environments, which will profoundly shape their future social and consumer behaviors.
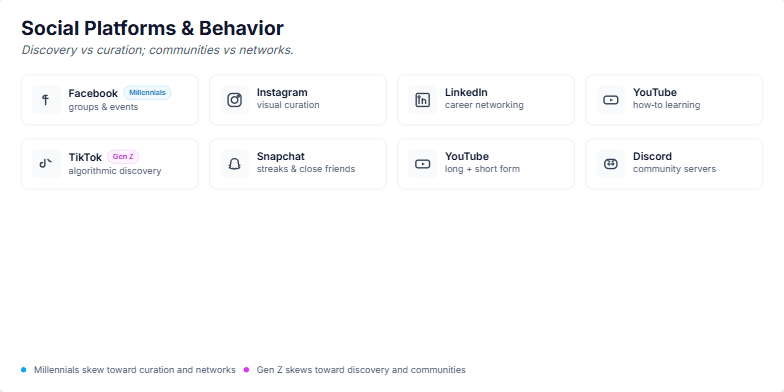
I need a slide that visually compares the social media platform preferences and behaviors of Millennials versus Gen Z. The central theme should be the contrast between two key axes: discovery versus curation, and communities versus networks. Please create two distinct rows, one for each generation. For Millennials, include Facebook, Instagram, LinkedIn, and YouTube, highlighting their use for curation and networking. For Gen Z, include TikTok, Snapchat, YouTube, and Discord, emphasizing their preference for algorithmic discovery and community building. Use icons for each platform and a clean, professional design.
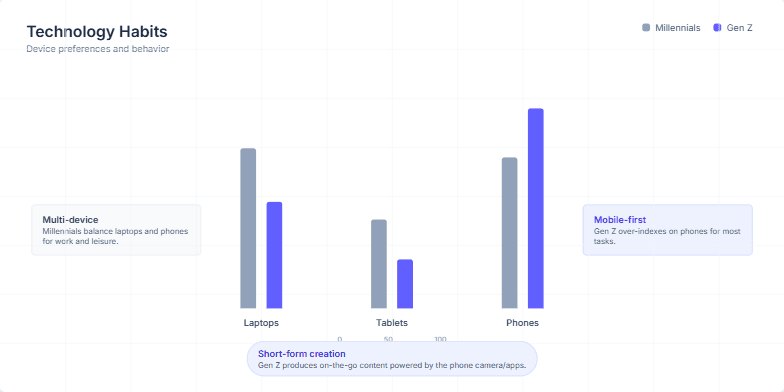
The user requested a presentation slide to visually compare the technology and device preferences of two key demographics: Millennials and Gen Z. The goal was to use a clear data visualization, specifically a clustered bar chart, to show the usage percentages for laptops, tablets, and phones. The slide needed to be animated to engage the audience and include summary callouts that interpret the data, highlighting the core behavioral differences like Millennials' multi-device usage versus Gen Z's mobile-first approach. The overall design was expected to be clean, modern, and easy to understand.
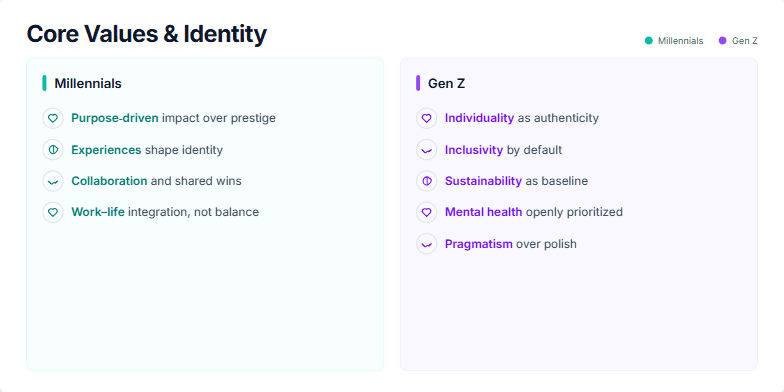
The user requested a presentation slide that visually compares the core values and identity-shaping principles of Millennials and Gen Z. The goal was to create a clear, side-by-side analysis for a business or marketing presentation. The prompt likely specified a two-column layout, with distinct color schemes to differentiate the two generations—teal for Millennials and violet for Gen Z. It would have included the specific value points for each group, such as "Purpose-driven impact" for Millennials and "Individuality as authenticity" for Gen Z. The user also required subtle animations for each point to enhance engagement and detailed speaker notes to guide the presenter.
I need an introductory slide for a presentation on the differences between Gen Z and Millennials. The tone should be modern, clean, and data-driven, not stereotypical. The design should be minimalist with a light background, perhaps a subtle texture, and a single accent color like blue. The main title should be 'Gen Z vs Millennials' and the subtitle should be 'Understanding Generational Differences in 2025'. I also need some speaker notes to set the stage for a balanced, nuanced discussion, outlining the topics that will be covered like work styles, communication, and technology habits.
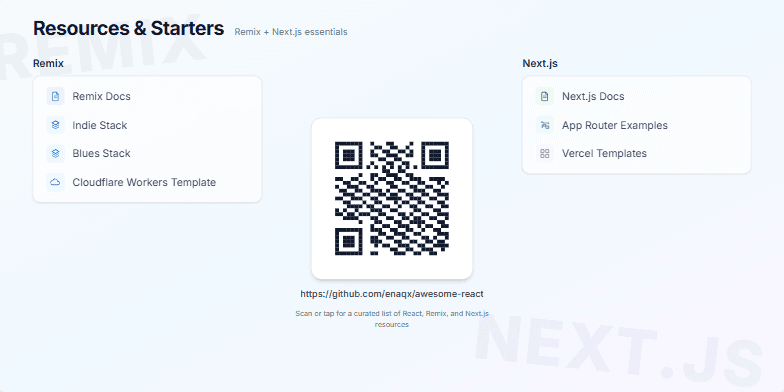
The user requested a resource slide for a technical presentation aimed at web developers. The goal was to provide a concise yet comprehensive list of essential starting points for two popular React frameworks: Remix and Next.js. The prompt specified a clean, modern, and visually appealing design that could effectively compare the resources side-by-side. A key requirement was a central, engaging call-to-action, like a QR code, that links to a more extensive, curated list of resources, encouraging audience interaction. The slide needed to be both informative for beginners and a useful reference for experienced developers evaluating these technologies.
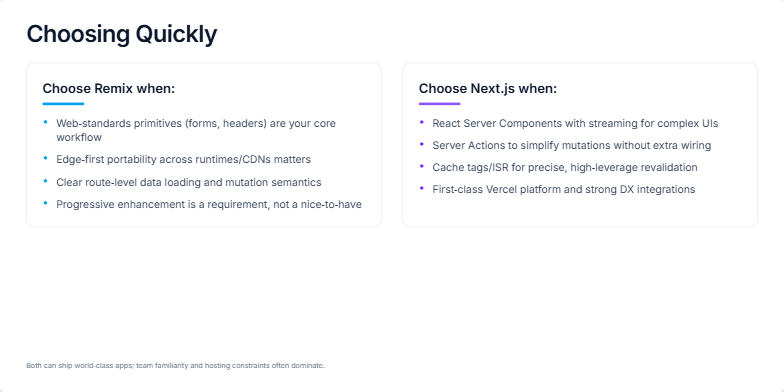
This slide is for a technical presentation aimed at web developers and engineering managers who need to decide between two popular JavaScript frameworks: Remix and Next.js. The goal is to provide a high-level, practical decision-making guide, not an exhaustive technical deep dive. It should quickly summarize the core philosophies and strengths of each framework in a visually balanced, two-column format. The content needs to highlight Remix's focus on web standards and portability, versus Next.js's emphasis on React Server Components, Server Actions, and its tight integration with the Vercel platform.
Want to generate your own slides with AI?
Start creating high-tech, AI-powered presentations with Slidebook.