Commercial Performance Growth and Revenue Share Increase
Description provided by the user:
Create a slide visualizing the growth in commercial performance and its increasing share of total revenue. Show data for 2024 and the first half of 2025. Include specific figures for revenue in RMB and USD equivalents, along with percentages representing their share of total revenue. Use a bar chart to visually represent the change in revenue share between these two periods. The slide should be clean, professional, and easy to understand, suitable for a business presentation. Animate elements for a dynamic presentation flow, revealing data points sequentially. Use a modern and sleek design, with a professional color palette. The slide dimensions should be 1200px by 600px. Include speaker notes outlining the key points to emphasize during the presentation.
1. Set the scene: This slide shows how commercial performance is accelerating and taking a bigger share of revenue.
2. Point to 2024: RMB 3.04B, around US$430M, accounting for 23.3% of total revenue.
3. Reveal H1 2025: RMB 4.81B, approximately US$670M, lifting the share to 34.7%.
4. Highlight the right chart: two bars show the revenue share jump from 23.3% to 34.7%, a clean visual step-up.
5. Conclude: Growth is not just absolute; the mix is shifting—commercial is becoming a larger engine of the business.
Behind the Scenes
How AI generated this slide
Structure the slide layout using a grid system for organized content placement.
Add a title and descriptive text elements using appropriate font sizes and styles for clear communication.
Incorporate dynamic count-up animations for numerical data to engage the audience.
Visualize the revenue share change with an animated bar chart, highlighting growth and contribution to overall revenue.
Apply a consistent color scheme and modern design elements for a cohesive and professional look.
Why this slide works
This slide effectively communicates the growth and increasing importance of commercial performance. The use of clear visuals, animations, and specific data points enhances audience engagement and understanding. The bar chart provides a concise comparison of revenue share across different periods, while the count-up animations add a dynamic element. The sleek design and professional color scheme maintain a consistent and polished presentation style. The clear and concise speaker notes further aid in delivering a compelling presentation.
Slide Code
You need to be logged in to view the slide code.
Frequently Asked Questions
What is the key message conveyed by this slide?
The key message is the substantial growth of commercial performance and its increasing contribution to the overall revenue, demonstrating its rising importance within the business.
How does the animation enhance the presentation?
The dynamic count-up animation for the numerical data and the animated bar chart make the presentation more engaging and visually appealing, drawing the audience's attention to the key performance indicators and their growth.
What is the purpose of the bar chart?
The bar chart provides a clear visual comparison of the revenue share between 2024 and the first half of 2025, making it easy for the audience to grasp the significant increase in commercial performance's contribution.
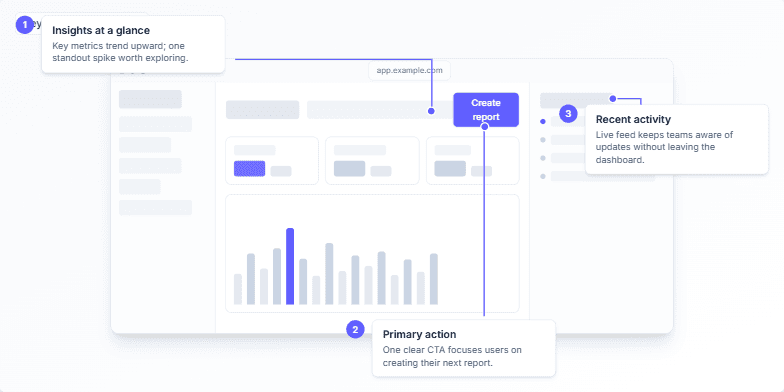
Create a slide demonstrating the key design principles of a dashboard UI. The dashboard should focus on delivering quick insights, guiding users with one clear callout color (e.g., indigo), and a simple layout with minimal clutter. The main components to highlight are an insights/metrics trend area, a primary call-to-action button (e.g., “Create report”), and a recent activity feed. The slide should include animated annotations to guide viewers through the key elements. Speaker notes should explain the design choices: grayscale for calm, one accent color for guidance, and a simple structure to shorten time to insight.
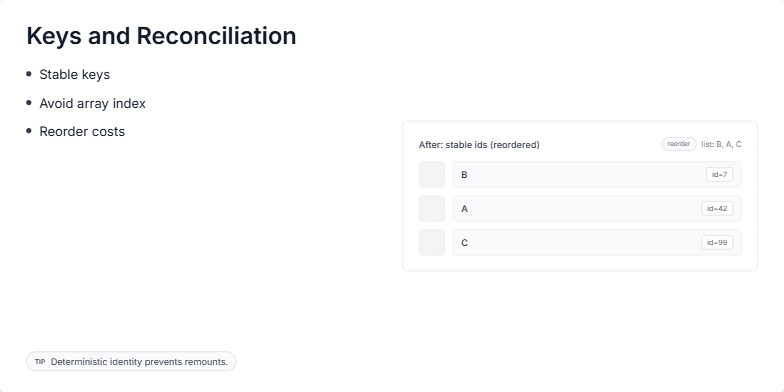
This slide explains the importance of using keys in React for efficient reconciliation. It visually demonstrates how stable keys, unlike array indices, help React identify and preserve component state during re-renders, especially when list items are reordered. The key concept is that stable identifiers prevent unnecessary component unmounts and remounts, leading to better performance and user experience. The slide shows a 'before' and 'after' comparison of a list rendered with array indices as keys versus stable IDs. This visualization emphasizes the benefits of stable keys in reducing re-rendering overhead. The goal is to educate developers on the proper usage of keys in React for optimal performance.
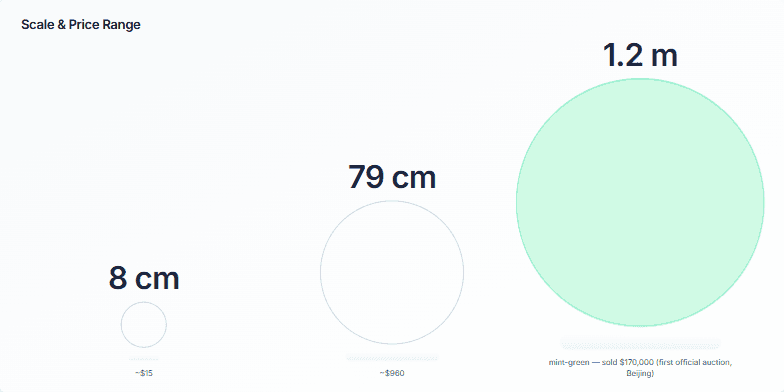
Create a slide visualizing the relationship between the size of an artwork and its price. Show how a small piece can be relatively inexpensive, while larger pieces command significantly higher prices, culminating in a high-value auction sale. Use circles to represent the artworks, scaling them proportionally to their size. Include labels for dimensions and prices. Highlight the most expensive piece with a distinct color. Provide speaker notes to guide a presentation of this slide, explaining the correlation between size, price, and the significance of the auctioned piece.
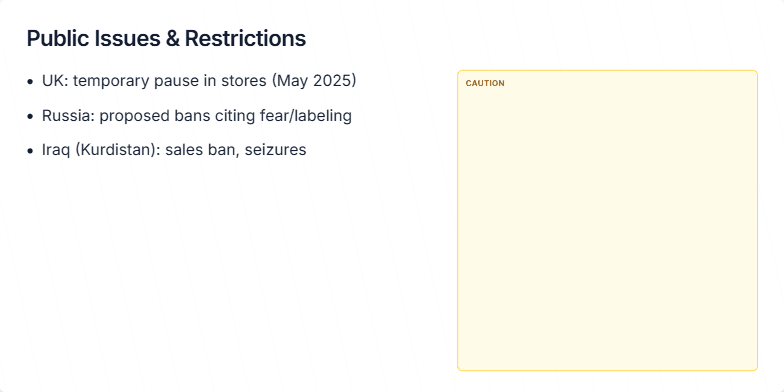
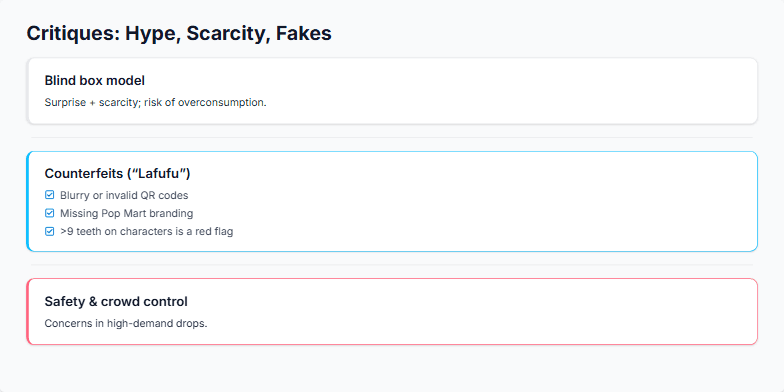
Create a slide that visually represents public issues and restrictions affecting product availability in different regions. Include specific examples such as a temporary pause in stores in the UK, proposed bans in Russia due to fear/labeling concerns, and sales bans/seizures in Iraq (Kurdistan). Design the slide with a cautionary theme, using yellow and black colors. Add speaker notes that explain the information on the slide in more detail. The overall tone should be neutral and informative, focusing on situational awareness rather than alarm.
This slide is part of a presentation discussing critiques of Pop Mart, a popular collectible toy company. The presentation aims to inform the audience about the potential downsides of the blind box model, the prevalence of counterfeit products, and safety concerns during high-demand product launches. The slide uses a checklist format to highlight key points about identifying fake Pop Mart figures and briefly touches upon the potential risks associated with the hype surrounding limited edition releases and the need for better crowd control measures at these events. The goal is to promote a balanced perspective on collecting, encouraging enthusiasm while emphasizing the importance of authenticity verification and personal safety.
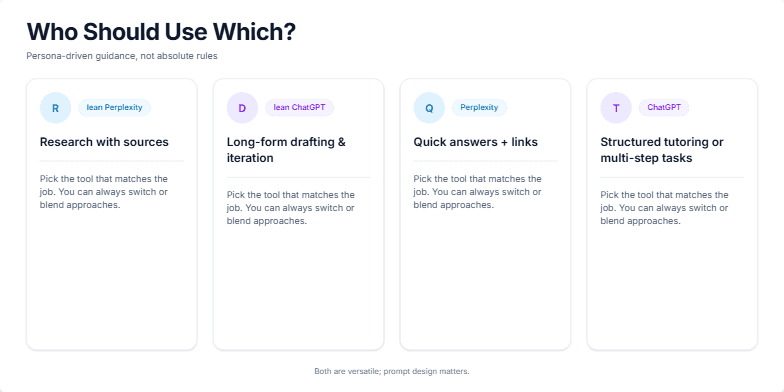
This slide is designed to guide users on selecting between Perplexity and ChatGPT based on their specific needs. It's not about rigid rules, but rather understanding the strengths of each tool and matching them to the task at hand. The slide visually presents four common use cases: research with sources, long-form drafting and iteration, quick answers with links, and structured tutoring or multi-step tasks. Each use case is paired with a recommendation of either Perplexity or ChatGPT, along with a brief explanation. The slide emphasizes that both tools are versatile and that prompt design plays a crucial role in the effectiveness of either. The overall message is to choose the persona that best fits the immediate task and adapt as the project evolves.
Want to generate your own slides with AI?
Start creating high-tech, AI-powered presentations with Slidebook.