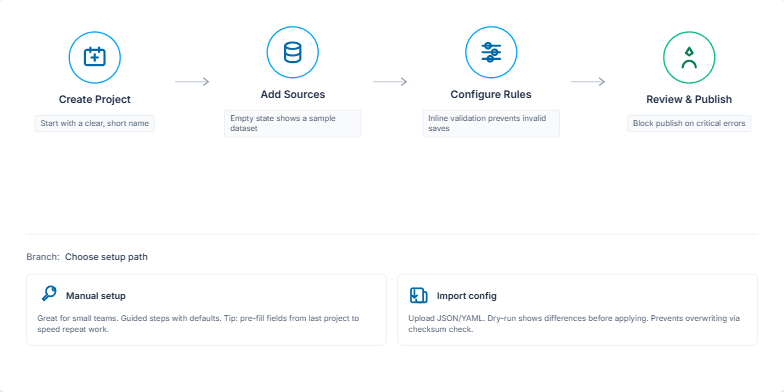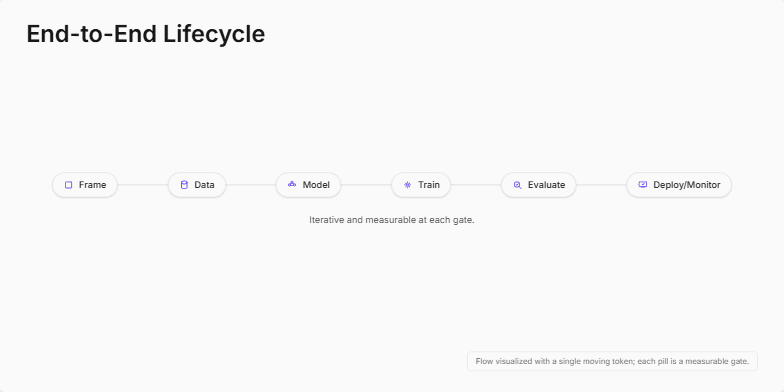
Visualizing the End-to-End Lifecycle of a Project
Create a slide visualizing the end-to-end lifecycle of a project, emphasizing continuous flow and measurable gates. The visualization should be clean and modern, using a single moving element to represent progress through the stages. The stages should be clearly labeled: Frame, Data, Model, Train, Evaluate, Deploy/Monitor. Include a concise caption highlighting the iterative nature of the process and the importance of measurement at each stage. Speaker notes should explain each gate and emphasize the continuous flow and feedback loop from Monitor back to Frame. The slide should be designed for a professional audience interested in project management and process optimization.