Strategies for Enhancing AI Model Efficiency and Reducing Operational Costs
Description provided by the user:
Create a slide for a technical audience about optimizing large AI models. The slide should cover key strategies for reducing cost and computational footprint without sacrificing quality. I want to see a list of techniques, including Chinchilla scaling, LoRA/QLoRA, pruning, and infrastructure tactics like using spot instances. Please include two charts to visualize the impact: a line chart showing how training loss decreases with more tokens (like in the Chinchilla paper) and a bar chart quantifying the cost savings from common inference optimizations like quantization and batching.
Title: Efficiency, Cost, and Footprint. Frame the goal: reduce spend and energy without hurting quality or user experience.
Start with Chinchilla intuition: for a fixed compute budget, training on more tokens lowers loss more than simply scaling parameters. This guides data strategy and training schedules.
Walk the left checklist: LoRA and QLoRA let us adapt strong base models cheaply in 4/8-bit; then pruning, distillation, and structured sparsity preserve quality while shrinking inference cost.
Cover runtime wins: activation and sequence packing, Flash/SDPA attention, and aggressive batching with KV-cache reuse. Highlight when tensor/sequence parallelism pays off.
Operational levers: elastic clusters, spot/preemptible nodes with solid checkpointing for resilience. Power choices: mixed precision (BF16/FP8) and right-sizing GPUs when latency budgets allow.
Point to the right charts: the line shows loss trending down as we feed more tokens per Chinchilla; it animates to emphasize the dynamic. The bars quantify typical savings from quantization and batching—stack these levers for compounding impact.
Close by tying back to goals: combine data/architecture choices with runtime and ops tactics to cut cost and footprint while maintaining or improving quality.
Behind the Scenes
How AI generated this slide
First, establish a two-column layout to balance dense textual information with visual data. The left column is designated for a comprehensive bulleted list of optimization techniques, while the right is reserved for charts.
Populate the left column with a curated list of key LLM efficiency strategies, covering data (Chinchilla scaling), fine-tuning (LoRA/QLoRA), model compression (pruning, distillation), runtime performance (Flash Attention, batching), and infrastructure management (spot instances, mixed precision).
Develop a custom React component for an SVG line chart to visualize the Chinchilla scaling principle. The chart plots a downward-sloping loss curve against training tokens, using `framer-motion` to animate the path drawing, emphasizing the trend.
Create a second React component for an animated SVG bar chart. This chart quantifies the cost savings from two high-impact techniques: quantization and batching. `framer-motion` is used to animate the bars growing to their final height, making the data reveal more dynamic.
Integrate the components and text into the main slide structure, applying a clean, professional design system with Tailwind CSS for consistent styling, colors (slate, teal, emerald), and typography.
Write detailed speaker notes that explain each point on the slide, connecting the abstract techniques in the list to the concrete impact shown in the charts, providing a clear narrative for the presenter.
Why this slide works
This slide is effective because it masterfully balances information density with clarity. The two-column structure effectively segregates the 'how' (the list of techniques) from the 'impact' (the charts), catering to different learning styles. By using custom-built, animated SVG charts with `framer-motion`, the slide transforms static data into an engaging story, visually demonstrating the benefits of Chinchilla scaling and inference optimizations. It provides a holistic overview of the LLM optimization stack, from training data strategy to deployment infrastructure, making it a valuable, single-source reference for engineers and technical leaders focused on AI cost management and MLOps. The clean aesthetic and clear labels ensure that complex technical concepts are presented in an accessible and professional manner.
Slide Code
You need to be logged in to view the slide code.
Frequently Asked Questions
What is the 'Chinchilla scaling law' and why is it important for cost-efficiency?
The Chinchilla scaling law, discovered by researchers at DeepMind, is a principle for training large language models. It suggests that for a fixed compute budget, it's more optimal to train a smaller model on more data (tokens) rather than training a larger model on less data. Previously, the trend was to scale model size (parameters) aggressively. Chinchilla demonstrated that loss decreases more effectively when token count is scaled in proportion to model size. This is crucial for cost-efficiency because it guides teams to allocate their budget more effectively toward data acquisition and processing, potentially achieving better performance with smaller, less expensive models to train and serve.
How do techniques like LoRA/QLoRA and quantization reduce costs?
LoRA (Low-Rank Adaptation) and QLoRA (Quantized LoRA) are parameter-efficient fine-tuning (PEFT) methods. Instead of retraining all the billions of parameters in a large model, they freeze the base model and train only a small set of new, 'adapter' weights. This drastically reduces the memory and compute requirements for fine-tuning, making it possible on less expensive hardware. QLoRA pushes this further by quantizing the base model to a lower precision (e.g., 4-bit) during training, further cutting memory usage. Quantization, in general, reduces model size and can speed up inference by representing weights with fewer bits (e.g., 8-bit or 4-bit integers instead of 16-bit floats), which lowers memory bandwidth and allows for faster computations on compatible hardware, directly translating to lower inference costs.
What is 'Batching + KV-cache reuse' and how does it improve inference performance?
Batching is the process of grouping multiple user requests together and processing them simultaneously in a single pass through the model. This is far more efficient than processing requests one by one because it better utilizes the parallel processing capabilities of GPUs. The KV-cache (Key-Value cache) is a crucial optimization for transformer models like LLMs. During text generation, the model calculates key and value states for each token. The KV-cache stores these states so they don't have to be recomputed for every new token in a sequence. 'KV-cache reuse' means intelligently managing and reusing this cache across different requests in a batch, especially for shared prefixes, which dramatically reduces redundant computation, lowers latency, and increases throughput, thereby reducing the per-token cost of inference.
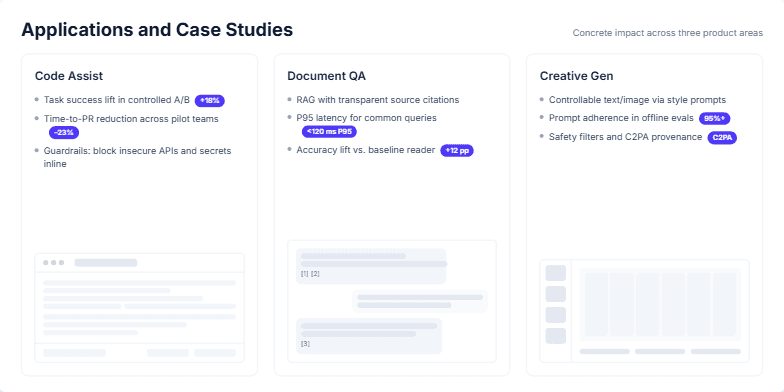
Create a business presentation slide titled 'Applications and Case Studies' that highlights the concrete impact of our AI initiatives across three key product areas. Use a three-column layout for 'Code Assist', 'Document QA', and 'Creative Gen'. For each column, include 3-4 bullet points with specific, quantifiable metrics and key features. For example, show percentage lifts, latency improvements, or accuracy gains. Also, include a simple, abstract visual mock-up for each application to provide context without being too detailed. The overall design should be clean, professional, and data-driven.
The user requested a technical presentation slide that clearly compares and contrasts the architectures of multimodal AI systems across three key domains: vision, audio, and video. The slide needed to visually break down the typical processing pipeline for each modality, from initial encoding to final reasoning with a Large Language Model (LLM). It was also important to showcase practical applications or tasks associated with each type of model, such as OCR for vision, ASR for audio, and step extraction for video. The design should be clean, organized, and easy to follow for an audience with some technical background in AI.
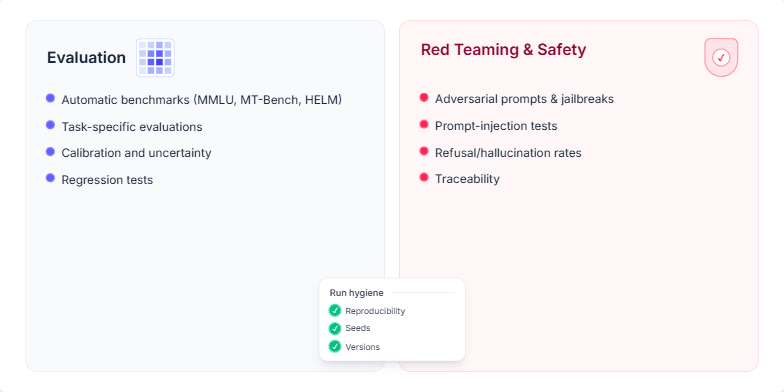
The user requested a slide detailing a company's comprehensive AI model validation process. The slide needed to be split into two main sections: performance evaluation and safety/red teaming. The evaluation part was to include standard benchmarks like MMLU and MT-Bench, task-specific tests, calibration, and regression testing. The safety section required coverage of adversarial prompts, jailbreaks, prompt injection, and metrics like refusal/hallucination rates. A key requirement was to also include a smaller element on 'run hygiene' to emphasize reproducibility, using seeds, and versioning, visually communicating a robust and trustworthy process.
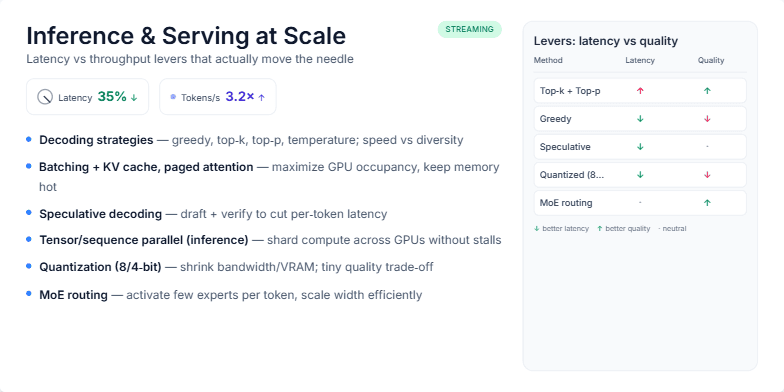
The user requested a technical presentation slide aimed at engineers and data scientists. The slide needs to cover the most effective techniques for optimizing Large Language Model (LLM) inference and serving at scale. It should explain key methods like decoding strategies, KV caching, speculative decoding, and quantization. A key requirement is to visually represent the trade-offs, specifically how each technique impacts latency versus model output quality. The slide should also include key performance indicators, like percentage reduction in latency and increase in tokens per second, to quantify the benefits of these optimizations.
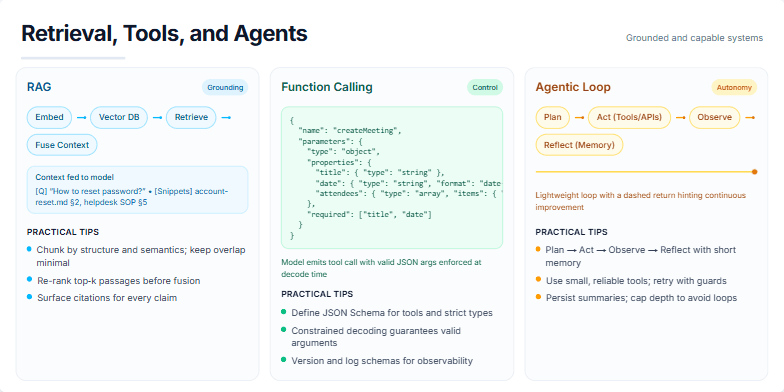
A user requested a presentation slide that visually compares three fundamental patterns for building advanced Large Language Model (LLM) applications: Retrieval-Augmented Generation (RAG), Function Calling, and Agentic Loops. The goal is to explain how these techniques contribute to creating AI systems that are both 'grounded' in facts and 'capable' of performing actions. The user asked for a clean, three-column layout, with each pattern having its own distinct color scheme, a simple diagram, and a list of practical development tips for implementation.
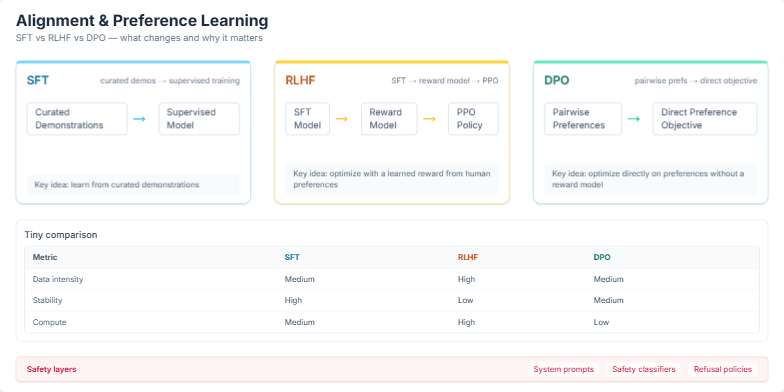
The user requested a presentation slide that explains and compares three key techniques for aligning large language models with human preferences: Supervised Fine-Tuning (SFT), Reinforcement Learning from Human Feedback (RLHF), and Direct Preference Optimization (DPO). The goal is to visually break down the process of each method, provide a clear side-by-side comparison of their characteristics like data intensity, stability, and compute requirements, and conclude with the overarching importance of safety layers that are applied regardless of the chosen training method.
Want to generate your own slides with AI?
Start creating high-tech, AI-powered presentations with Slidebook.