Open with a calm tone. Let the title fade in before speaking.
As the title appears: “Today we’re going deep on Generative AI — how we build systems that scale, and how we keep them safe.”
Pause briefly, then point to the subtitle to set the agenda: systems design, scaling strategies, and safety practices.
Introduce yourself: “I’m Maya Chen, Principal Research Engineer at Vector Labs.”
Acknowledge the event and date: “Thanks for having me at the AI Systems Summit here in San Francisco.”
Set expectations: “We’ll balance practical engineering details with a human lens on responsible deployment.”
Transition: “Let’s start with the systems foundations that make modern generative models possible.”
Open by framing the slide: this is a concise overview of key inflection points and the forces shaping GenAI in 2025.
First, walk the left column bullets as they appear. Explain compute trends: specialized accelerators, batching, sparsity, and the push for efficient inference. Then data scale: synthesis, curation, and multimodal datasets improving quality over sheer volume. Finally, the open vs closed ecosystem tension between proprietary APIs and rapidly improving open models.
Next, point to the sparkline: model releases have grown quickly, especially post-2023, reflecting community and vendor momentum.
Then narrate the timeline year by year as it reveals: 2017 Transformers reshape sequence modeling; 2020 GPT-3 demonstrates few-shot capabilities; 2021 diffusion models bring image breakthroughs; 2022 RLHF formalizes alignment and usability; 2023 open models and quantization make local inference practical; 2024 multimodal goes mainstream; 2025 highlights agentic systems and efficient on-device execution.
Close with the small callouts: what changed from 2024 to 2025 and what matters now—efficiency, high-quality data, and safe autonomous orchestration.
Open by framing the landscape: four families cover most generative use cases. We’ll scan what they do and how we measure them.
First, Large Language Models: they predict tokens to generate and transform text. Typical jobs are chat and Q&A, summarization, and code generation. The key constraint is context length in tokens, which gates how much they can consider at once.
Second, Diffusion Models: they denoise noise to create media. Think text-to-image, image editing, and text-to-audio. We care about FID as a quality proxy, where lower is better.
Third, Multimodal Foundation Models: they reason across text, images, and audio. Use-cases include visual question answering, chart and table understanding, and grounding speech to text. We often compare models by win-rate on standard evaluations.
Fourth, Agentic Systems: they orchestrate models with tools, memory, and planning. Common tasks are tool use, web browsing, and workflow automation. What matters most is task success rate on realistic benchmarks.
Close by linking choices to needs: pick the family that matches your input/output modality; then optimize for the metric that aligns with your product goal.
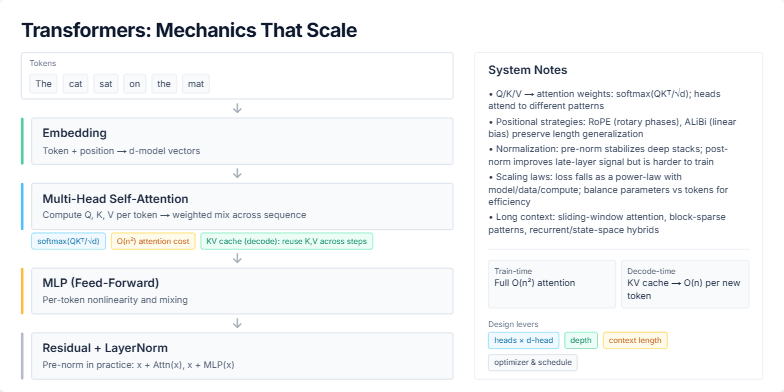
Title: Transformers: Mechanics That Scale. We’ll walk the forward pass and tie it to system-level choices.
Step 1 — Tokens enter: Show the token sequence. Explain embeddings: each token becomes a d-model vector, with position mixed in.
Step 2 — Attention computes: Move to the Multi-Head Self-Attention block. Describe Q, K, V projections and attention weights via softmax(QKᵀ/√d). Emphasize O(n²) memory/compute during training. Explain KV cache at decode time: we reuse keys and values so each new token is O(n), enabling fast generation.
Step 3 — MLP and Residuals: Show the feed-forward block as per-token nonlinearity. Then highlight residual connections and LayerNorm. Note that pre-norm stabilizes deep stacks; post-norm is less common for very deep models.
Right-side notes: Briefly cover positional strategies like RoPE and ALiBi and why they help generalize to longer contexts. Mention empirical scaling laws: loss falls as a power-law with model/data/compute—so balance parameters and tokens. Close with long-context variants: sliding window, block-sparse, and recurrent hybrids that reduce the quadratic cost.
Takeaway: the core is simple—Embed → Attend → MLP with Residual/Norm—but the system wins by managing n² cost, caching at decode, and choosing positions, depth, and sparsity wisely.
Title: set the frame. We’ll build an intuition for diffusion: how we go from pure noise to a meaningful image.
Step 1: Point to the first tile. Explain the forward process q(x_t | x_{t-1})—we keep adding Gaussian noise until the signal is unrecognizable.
Step 2: Point to the second tile. Introduce the reverse process p_theta(x_{t-1} | x_t)—a learned denoiser that predicts how to remove a little noise at a time.
Step 3: Point to the third tile. Mention that a U-Net is the workhorse predicting either the noise or residual at each step.
Step 4: Point to the fourth tile. Touch on schedulers: DDPM uses stochastic steps; DDIM provides a deterministic path for fewer, faster steps.
Step 5: Draw attention to the CFG bar and the highlighted last tile. Explain classifier-free guidance: increasing guidance pushes samples closer to the condition for sharper detail, at the cost of some diversity. Summarize: iterate denoise, guided by the model and scheduler, to turn noise into signal.
Title: Data and Tokenization. I will walk through how raw data becomes training-ready text and how it turns into tokens.
Left column first: We start with sources: web, code repositories, and documentation. Emphasize licensing and explicit consent—what we can legally and ethically use.
Next: Deduplication with MinHash and LSH to avoid overfitting to repeats. Then filtering passes: remove NSFW, toxic content, and low-quality or boilerplate pages.
Then: Dataset mixing and weighting—balancing code vs. prose vs. domain-specific corpora. Finally, contamination checks to ensure eval sets do not leak into training.
Right visuals: Tokenization. First show the raw word “tokenization”. Then reveal how BPE splits it: to | ken | ization, and mention the merge history—these merges are learned to minimize sequence length.
Checklist: Call out that our pipeline passed core gates: dedup, safety, quality heuristics, license/consent, and contamination checks.
Histogram: Show the distribution of sequence lengths. Bars growing in highlight that most examples sit around the middle bins, and we still have a tail toward longer sequences. This informs batching and max context decisions.
Close: Tie the pipeline quality to stable tokenization behavior and efficient training—garbage in, garbage out, even with a great tokenizer.
First, set the stage: we’ll walk left-to-right through a practical training pipeline and where we optimize it.
Start with the sharded dataset and the dataloader — emphasize balanced shards and prefetching to keep GPUs fed.
Introduce mixed precision with BF16. Call out that it delivers speed and memory savings while maintaining stability; use loss scaling only if needed.
Move to the optimizer: AdamW is the baseline; Lion can be a drop-in when you want sharper convergence on some workloads.
Explain the learning-rate schedule: warmup to reach a stable plateau, then cosine decay to land smoothly.
Cover gradient checkpointing: trade compute for memory so you can increase global batch size.
At scale, discuss distributed strategies: data parallel, tensor parallel, pipeline parallel; combine with ZeRO to shard optimizer states.
Mention validation as a separate loop and frequent checkpoints for safety and resumability.
On the right, highlight stability tips: grad-norm clipping around 0.5–1.0, and using warmup then cosine decay. For loss spikes, try lowering LR, resetting optimizer state, and reviewing precision casts.
Close with throughput: show that tokens per second grows with batch size, but stop when you hit memory or instability limits. The goal is to maximize tokens/sec while keeping the loss smooth.
Start by framing the slide: we’re comparing three approaches to alignment through preferences—SFT, RLHF, and DPO.
First, SFT: explain it as learning directly from curated demonstrations via standard supervised learning. It’s stable and straightforward but limited to what’s shown in the demos.
Advance to RLHF: describe the pipeline—start from an SFT model, train a reward model from human preference data, then optimize with PPO. Emphasize improved alignment with human judgments, but note training instability and higher data/compute costs.
Advance to DPO: highlight that it skips the explicit reward model and optimizes a direct objective from pairwise preferences. It’s simpler and typically more stable than PPO-based RL, with lower compute.
Show the comparison table: quickly summarize the trade-offs—data intensity and compute are highest for RLHF; SFT is medium across the board; DPO aims for lower compute with medium data needs and moderate stability.
Finally, bring in the safety overlay: stress that regardless of the method, we layer system prompts, safety classifiers, and refusal policies to guard against unsafe outputs. These are orthogonal controls that wrap around the training approach.
Close by suggesting selection guidance: start with SFT for baseline capability, consider DPO for preference alignment efficiently, and use RLHF when you need the highest fidelity to nuanced human judgments and have the budget to support it.
First, set the frame: we want models that are both grounded and capable. We will walk through three patterns that layer up to that goal.
Start with RAG. Explain the simple flow: embed content, store in a vector database, retrieve relevant chunks, and fuse them into the prompt. Emphasize three practical tips: chunk by structure and semantics with minimal overlap, re-rank retrieved passages before fusion, and always attach citations so outputs are traceable.
Move to function calling. Show how we constrain the model with a JSON Schema. The model fills arguments via a tool call, and constrained decoding keeps outputs well-formed. Encourage versioning and logging of schemas for reliability and observability.
Finish with the agentic loop. Describe the cycle: plan, act via tools or APIs, observe results, and reflect into memory. Keep the loop lightweight: bounded depth, retries and guards on tools, and persistent summaries to improve over time without drifting.
Close by connecting the three: RAG grounds answers, function calling lets the model take precise actions, and the agentic loop stitches those actions into iterative capability.
Open by framing the slide: we are optimizing both latency and throughput; the badges show we care about streaming experiences.
Call out the count-up metrics: we often aim for around 35% latency reduction and a 3.2× tokens-per-second gain by combining techniques, not a single silver bullet.
Walk the bullets top to bottom:
First, decoding strategies: greedy, top-k, top-p, temperature. Emphasize the speed–diversity trade-off; greedy is fastest but can reduce quality.
Second, batching with KV cache and paged attention to keep memory hot and ensure high GPU occupancy. This is the biggest lever for serving fleets.
Third, speculative decoding: draft-and-verify reduces per-token latency without significantly hurting quality.
Fourth, tensor or sequence parallelism at inference time: shard computations across GPUs while minimizing synchronization stalls.
Fifth, quantization to 8/4-bit: reduces bandwidth and VRAM, often with minor quality loss; pair with calibration for safety-critical domains.
Sixth, MoE routing: activate only a few experts per token to scale width cost-effectively; be mindful of routing overhead and load balance.
Shift attention to the right panel. Explain the tiny table: arrows indicate how each lever typically affects latency and quality. Green is good relative movement; red is the cost. Neutral dots mean impact is usually minimal.
Close by reinforcing: combine batching, cache-aware attention, quantization, and speculative decoding for the best latency; tune decoding and MoE routing to preserve quality.
Title: Efficiency, Cost, and Footprint. Frame the goal: reduce spend and energy without hurting quality or user experience.
Start with Chinchilla intuition: for a fixed compute budget, training on more tokens lowers loss more than simply scaling parameters. This guides data strategy and training schedules.
Walk the left checklist: LoRA and QLoRA let us adapt strong base models cheaply in 4/8-bit; then pruning, distillation, and structured sparsity preserve quality while shrinking inference cost.
Cover runtime wins: activation and sequence packing, Flash/SDPA attention, and aggressive batching with KV-cache reuse. Highlight when tensor/sequence parallelism pays off.
Operational levers: elastic clusters, spot/preemptible nodes with solid checkpointing for resilience. Power choices: mixed precision (BF16/FP8) and right-sizing GPUs when latency budgets allow.
Point to the right charts: the line shows loss trending down as we feed more tokens per Chinchilla; it animates to emphasize the dynamic. The bars quantify typical savings from quantization and batching—stack these levers for compounding impact.
Close by tying back to goals: combine data/architecture choices with runtime and ops tactics to cut cost and footprint while maintaining or improving quality.
Start by framing the slide: the left side is how we measure performance; the right side is how we actively try to break and safeguard it.
On the left, call out the automatic benchmarks like MMLU, MT-Bench, and HELM to establish comparability. Then mention task-specific evaluations that reflect our actual use cases.
Emphasize calibration and uncertainty: we don’t just look at accuracy, we look at how well confidence aligns with correctness. Close with regression tests to prevent backsliding across releases.
Point to the small confusion-matrix graphic as a visual anchor for measurement and diagnostics.
Move to the right: explain adversarial prompts and jailbreaks, then prompt-injection tests for tool-using agents and integrations.
Highlight refusal and hallucination rates as quantifiable safety outcomes, and end with traceability so we can audit what happened and why.
Surface the small checklist overlay: reproducibility, seeds, and versions—these make all results trustworthy and repeatable across environments.
Finally, bring attention to the shield icon: it represents the protective layer built through red teaming and safeguards. Underscore that both columns run continuously in CI, informing decisions release by release.
Open by framing the slide: three parallel pipelines for vision, audio, and video. We’ll reveal them left-to-right and briefly connect model blocks to real tasks.
First, Vision (VLM). Explain the diagram: a vision encoder like ViT or CLIP turns pixels into embeddings. A projector aligns these with the LLM’s token space. The LLM handles reasoning and generation. Point to tasks: OCR, chart question answering, and general VQA. Call out the example thumbnail with bars and detection boxes to hint at OCR and chart parsing.
Second, Audio. Describe the front end: waveform to mel spectrogram. An audio encoder produces representations that feed a text decoder or LLM. Emphasize the bi-directional nature: ASR and TTS, plus audio captioning.
Third, Video. Note the temporal dimension: either sample frames or build spatiotemporal tokens. A projector adapts these to the LLM. Tasks include step extraction from instructional videos and grounding actions in time.
Close by connecting the patterns: modality-specific encoders produce aligned tokens, a small projector bridges to a general LLM, and the LLM performs reasoning. Encourage questions on choices like frame rate, spectrogram parameters, and projector design.
We’re focusing on concrete impact across three areas: Code Assist, Document QA, and Creative Generation.
First, Code Assist. In controlled A/B tests we saw an 18% lift in task success, and pilot teams cut time-to-PR by 23%. Guardrails block insecure APIs and secrets right in the editor.
Next, Document QA. It uses retrieval-augmented generation with explicit citations, so answers are traceable. P95 latency stays under 120 milliseconds, and accuracy improves by 12 percentage points versus our baseline reader.
Finally, Creative Generation. We provide controllable outputs via style prompts. In evaluations, we hit over 95% prompt adherence, and we enforce safety filters with provenance via C2PA to track origin.
Together, these case studies show measurable gains and safe-by-design behavior, not just demos.
First, set the frame: we’re mapping concrete AI risks to concrete mitigations so governance is actionable, not abstract.
On the first reveal, call out the left column. Each risk appears in muted red to signal exposure: hallucination, prompt injection, data leakage, copyright, privacy, and model collapse.
Next, bring in the right column. As mitigations slide in, note how the risks settle to neutral — the goal is to move from alarm to assurance.
Walk each pair briefly:
Hallucination maps to verification and citations.
Prompt injection is contained by sandboxed tools and allowlists.
Data leakage is addressed with PII detection and redaction.
Copyright concerns use watermarking and provenance.
Privacy is enforced through policy filters.
Model collapse is resisted with continuous red teaming.
Emphasize that the connecting lines represent coverage — every risk has a named control.
Close with the compliance posture in the footer: GDPR, SOC 2, ISO 27001 — aligning technical controls to recognized standards.
Title: Roadmap and Q&A. Set context: we will cover near-, mid-, and long-term directions, then open for questions.
Near-term: Emphasize shipping reliability. Call out tool-use reliability, better evals to measure real progress, and small specialized models for targeted tasks.
Mid-term: Focus on bringing intelligence closer to users. Mention on-device and federated approaches for privacy and speed, and energy efficiency as a core constraint.
Long-term: Share the big bets. Talk about stronger reasoning, robust memory, and lifelong learning that adapts over time.
Point to the QR: scanning gives access to the deck, resources, and contact information. Invite questions warmly and thank the audience.