An overview of the data and tokenization pipeline for training large language models, covering quality and splits.
Description provided by the user:
This slide was designed to provide a comprehensive yet digestible overview of the crucial pre-training stage for large language models: data preparation and tokenization. The user needed to explain the multi-step data pipeline, from sourcing and licensing to cleaning and filtering. It also needed to visually demystify the concept of tokenization using an example like Byte-Pair Encoding (BPE). The goal was to combine conceptual points with concrete visuals like a data distribution histogram and a quality assurance checklist to illustrate the entire process effectively.
Title: Data and Tokenization. I will walk through how raw data becomes training-ready text and how it turns into tokens.
Left column first: We start with sources: web, code repositories, and documentation. Emphasize licensing and explicit consent—what we can legally and ethically use.
Next: Deduplication with MinHash and LSH to avoid overfitting to repeats. Then filtering passes: remove NSFW, toxic content, and low-quality or boilerplate pages.
Then: Dataset mixing and weighting—balancing code vs. prose vs. domain-specific corpora. Finally, contamination checks to ensure eval sets do not leak into training.
Right visuals: Tokenization. First show the raw word “tokenization”. Then reveal how BPE splits it: to | ken | ization, and mention the merge history—these merges are learned to minimize sequence length.
Checklist: Call out that our pipeline passed core gates: dedup, safety, quality heuristics, license/consent, and contamination checks.
Histogram: Show the distribution of sequence lengths. Bars growing in highlight that most examples sit around the middle bins, and we still have a tail toward longer sequences. This informs batching and max context decisions.
Close: Tie the pipeline quality to stable tokenization behavior and efficient training—garbage in, garbage out, even with a great tokenizer.
Behind the Scenes
How AI generated this slide
The initial prompt was broken down into four key areas: the data pipeline process, the tokenization mechanism, data distribution, and quality assurance. This structure directly informed the four main content cards.
A two-column layout was chosen to create a logical flow. The left column outlines the conceptual steps of the data pipeline, while the right column provides tangible visual examples and outcomes of that pipeline, such as the tokenization process, sequence length distribution, and a final quality checklist.
Framer Motion was used to add sequential animations to each component. The list items, tokenization example, and histogram bars appear incrementally. This controlled reveal guides the audience's focus and makes complex topics easier to digest step-by-step.
A professional and clean design was implemented using Tailwind CSS. A consistent color palette with slate grays for text, and accents of sky blue, emerald, and indigo for highlights and data visualizations, creates a cohesive and visually appealing technical presentation.
Why this slide works
This slide excels because it effectively balances information density with visual clarity. The two-column structure separates the 'how' (the pipeline steps) from the 'what' (the results and examples), which is a powerful teaching method. The animated visuals, especially the BPE tokenization breakdown and the growing histogram bars, transform abstract concepts into intuitive demonstrations. This use of motion graphics makes the technical content more engaging and memorable. The final checklist card provides a strong sense of closure and reinforces the thoroughness of the data quality process, building confidence in the resulting AI model.
Slide Code
You need to be logged in to view the slide code.
Frequently Asked Questions
What is tokenization and why is Byte-Pair Encoding (BPE) a common method?
Tokenization is the process of breaking down a piece of text into smaller units called tokens, which can be words, subwords, or characters. Models process these tokens instead of raw text. Byte-Pair Encoding (BPE) is a popular subword tokenization algorithm. It starts with a vocabulary of individual characters and iteratively merges the most frequent adjacent pair of tokens. This approach is effective because it can represent any word, avoids the issue of 'unknown' words common with word-level tokenizers, and keeps the vocabulary size manageable while capturing common word parts and morphemes, leading to efficient model learning.
Why is data deduplication using techniques like MinHash/LSH crucial for training models?
Data deduplication is crucial because large-scale datasets, especially those scraped from the web, often contain vast amounts of repeated or near-identical content. Training a model on this redundant data can cause it to overfit, memorizing specific phrases or examples instead of learning general patterns. This hurts its ability to generalize to new, unseen data. Techniques like MinHash and Locality-Sensitive Hashing (LSH) are probabilistic methods that efficiently find and remove these duplicates at scale, ensuring the training data is diverse and representative, which leads to a more robust and capable model.
What does 'contamination checks' refer to in a data pipeline?
Data contamination refers to the accidental inclusion of data from evaluation or test sets into the training dataset. If a model is trained on the same data it will be tested on, its performance metrics will be artificially inflated, giving a false impression of its true capabilities. Contamination checks are a critical final step in the data pipeline where the training data is rigorously compared against standard benchmarks and held-out evaluation sets to ensure there is no overlap. This guarantees that the model's performance is evaluated fairly and accurately on genuinely unseen data.
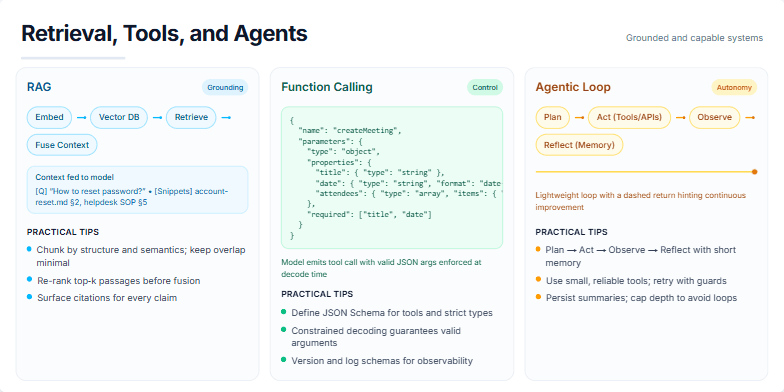
A user requested a presentation slide that visually compares three fundamental patterns for building advanced Large Language Model (LLM) applications: Retrieval-Augmented Generation (RAG), Function Calling, and Agentic Loops. The goal is to explain how these techniques contribute to creating AI systems that are both 'grounded' in facts and 'capable' of performing actions. The user asked for a clean, three-column layout, with each pattern having its own distinct color scheme, a simple diagram, and a list of practical development tips for implementation.
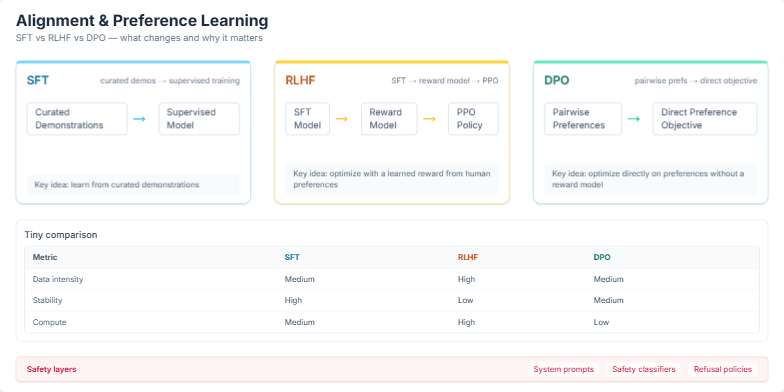
The user requested a presentation slide that explains and compares three key techniques for aligning large language models with human preferences: Supervised Fine-Tuning (SFT), Reinforcement Learning from Human Feedback (RLHF), and Direct Preference Optimization (DPO). The goal is to visually break down the process of each method, provide a clear side-by-side comparison of their characteristics like data intensity, stability, and compute requirements, and conclude with the overarching importance of safety layers that are applied regardless of the chosen training method.
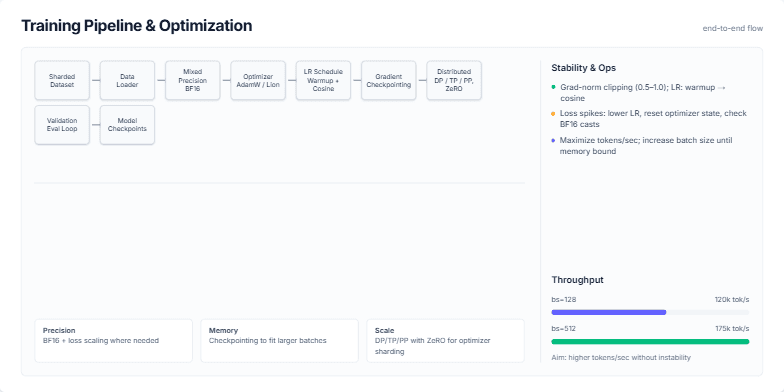
Create a slide that visually breaks down a standard end-to-end training pipeline for a large language model (LLM). It should start from the dataset and go all the way to model checkpoints. For each stage, like data loading, mixed precision, and distributed training, show the key technologies or concepts (e.g., BF16, AdamW, ZeRO). The slide should also include a sidebar with practical tips on ensuring training stability (like handling loss spikes) and a section on optimizing for throughput, showing how batch size affects tokens/second. The overall aesthetic should be clean, technical, and professional.
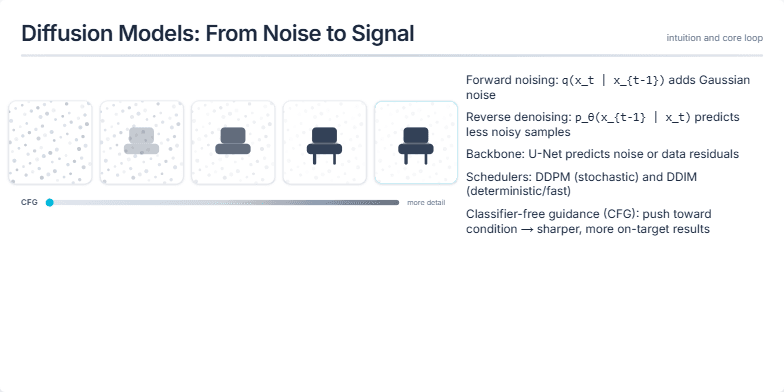
Create a presentation slide that visually explains the core intuition behind diffusion models. The slide should be titled 'Diffusion Models: From Noise to Signal'. On one side, show a visual progression from pure noise to a clear image (like a chair) in several steps. On the other side, list out the key concepts step-by-step: 1. Forward noising, 2. Reverse denoising, 3. The U-Net architecture, 4. Schedulers (DDPM/DDIM), and 5. Classifier-Free Guidance (CFG). Animate each point to appear with its corresponding visual step. For the final point on CFG, add a visual element like a slider to represent guidance strength.
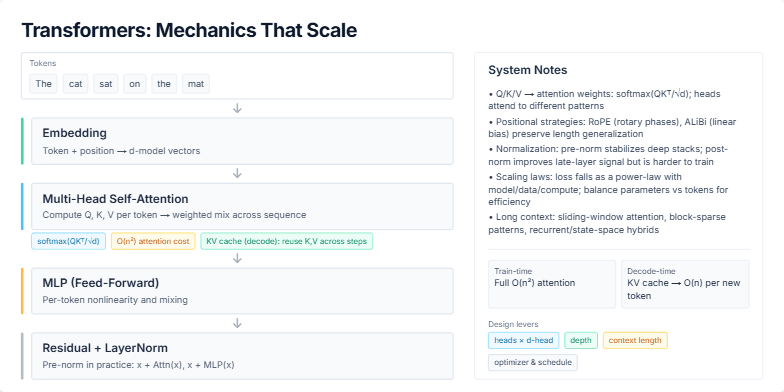
The user requested a slide that explains the forward pass of a Transformer model, titled "Transformers: Mechanics That Scale". The slide needs to visually walk through the main components, starting from input tokens and proceeding through embedding, multi-head self-attention, the MLP, and residual/norm layers. It should connect these mechanics to system-level choices and optimizations, such as the O(n²) cost of attention, the role of the KV cache in decoding, positional strategies like RoPE, and the impact of scaling laws on model training and efficiency.
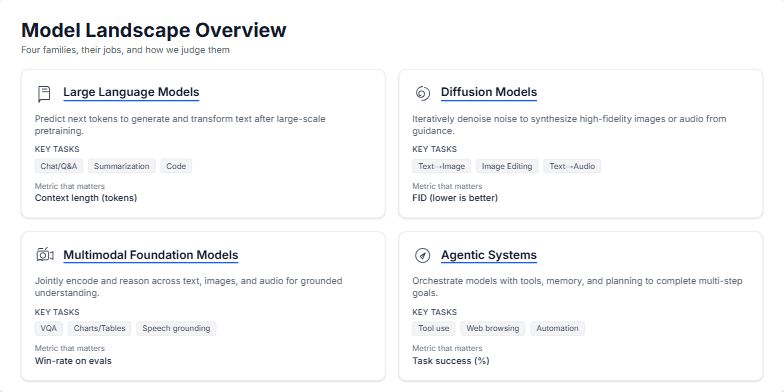
Create a slide that explains the main types of modern AI models. I want to cover four key categories: Large Language Models (LLMs), Diffusion Models for images, Multimodal Models that handle text and images, and Agentic Systems that can take actions. For each one, briefly define it, list a few example tasks, and mention the most important performance metric. The design should be clean, professional, and use a card-based layout to compare them side-by-side. Use simple icons to represent each category. The overall goal is to give a clear, high-level overview for someone new to the field.
Want to generate your own slides with AI?
Start creating high-tech, AI-powered presentations with Slidebook.